Who do you think pays more in property tax, the owner of this recently-sold five-story Bed-Stuy brownstone?
Or the owner of this tiny one-bedroom Bed-Stuy condo?
That’s right, it’s the tiny condo owner.
Am I missing something, or is New York City’s property tax system pretty wild?
After reading so many pieces about Mayor Mamdani’s pied-a-terre tax, the properties that might fall through the cracks, and the political landscape of New York City’s property ownership, I wondered what it looked like overall. I searched for a map of NYC tax assessments and couldn’t find something that mapped out the whole city at once, so somehow I decided the best thing to do was make my own map. I can’t resist a tippecanoe challenge.
Even once I mapped the NYC Department of Finance data, it still wasn’t really clear. As I spent more time trying to make sense of the tax process, I was shocked. I truly wasn’t expecting New York City to be worse than California’s Proposition 13. But I think it might be.
How the system works
The paper tax rates are huge:
But these are actually applied to “assessed value” that is codified as a percentage of the market value.
Which results in these actual tax rates if applied to the market value.
Tax rate
(of market value)
(Look, I didn’t choose to specify tax rates with 5 significant figures — you can blame New York City for that one.)
Let’s pause here, because what are these tax classes anyway?
Tax class 1
one to three unit residential buildings
Tax class 2
residential buildings with more than 4 units (rentals, condos and co-ops)
Tax class 3
utility property
Tax class 4
commercial non-residential property
So this looks like a big issue! New York City, a city with more renters and high-rise dwellers than any other in the United States, forces those living in dense buildings to pay over 4× the property tax of single-family home owners and duplex denizens.
Unless… the “market value” isn’t actually the market value at all. And in New York City, as the Department of Finance (DOF) defines it, it kind of isn’t.
Tax class 1
"The DOF uses statistical modeling to analyze prices of similar properties (based on factors such as size and location) that sold in your neighborhood in the prior three years."
Tax class 2
"State law mandates that the DOF value all tax class 2 properties as income-producing, based on their income and expenses. We use a statistical model as a tool to find typical income and expenses for properties similar to yours in terms of size, location, number of units, and age. Then we apply a formula to the income data to get to your market value. The law requires that we value co-ops and condos as if they were rental buildings, even though they are not income-producing."
Tax class 3
"The DOF uses the cost of constructing, reproducing, or replacing the building added to the land value."
Tax class 4
"The DOF uses your property's income earning potential and expenses. Estimated annual income is based in part on information you provide on the annual Real Property Income and Expense (RPIE) Filing. Statistical modeling is also used as a tool in this process."
Note the significant difference in methodology between Class 1 and Class 2 properties, where even condos are valued as though they were income producing rental buildings, which are difficult to compare due to different market pressures and financing timelines. This methodological wrinkle has been blamed in recent months for significantly undervaluing hyper-luxury horizontal real estate such as penthouses on Billionaire’s Row in Manhattan, which wouldn’t qualify under some pied-a-terre tax proposals. (I believe this has been corrected in the final version.)
However, this difference in valuation also has the side effect of helping to equalize the huge discrepancy we just saw in property tax rates between condo owners and single-family-home owners (which are also generally under-valued, just under-valued less).
Unfortunately, this discrepancy gets much worse when we look at the way increases in assessed value and limited differently across tax classes.
Over time, especially in parts of the city with rapid growth in property values, this has led many class 1 properties to have assessed values at just 5-20% of their calculated assessed value, which is in turn just 6% of the DOF calculated “market value”. For example, the townhouse at 495 Madison St in Bed-Stuy, sold a few years ago and now valued at $1,567,000 according to the DOF, has an assessed value of just $6,377. For an entire brownstone.
Policy that helps long-time residents stay in their homes is important, and neighborhood stability benefits everyone. But what really shocked me, especially after analyzing California, is that these extreme assessment discounts don’t disappear with the sale of the property. Instead, the new owner, whether a lucky individual or an anonymous LLC like the property above, inherits the discount. As the neighborhood changes and many long-time homeowners leave (or are forced to leave) the investors and petite bourgeoisie who move in will pay the same extremely low rate.
However, this isn’t even the complete picture yet. Exemptions, which reduce the taxable value of a building, and abatements, which reduce the tax, are widespread, especially among more recent rental housing, and have seemingly been applied as a patch over this entire convoluted system. Some of the more common tax abatements include the J-51 abatement (for expanding a building with rental housing, requires units be rent stabilized for years) and the solar abatement for smaller buildings, and a co-op abatement for owner occupied units. Exemptions can include fully tax exempt buildings (like parks and NYCHA projects) as well as the 421-a exemption for rental housing construction. More on this below, when we dive into some case studies.
Eight case studies
What does all of this together really mean? I can’t say I have a complete understanding, but it definitely seems that the property tax burden falls disproportionately on those living in larger buildings.
Let’s zoom in even more on Bed-Stuy and look at a few different types of homes and how they are taxed. I chose these arbitrarily, with the only real constraint being the neighborhood and recent sale/rental data.
176 Mac Donough St, a single-family brownstone
This is 176 Mac Donough St, a 3728 square foot six (!) bedroom single-family brownstone near the Kingston-Throop C station.
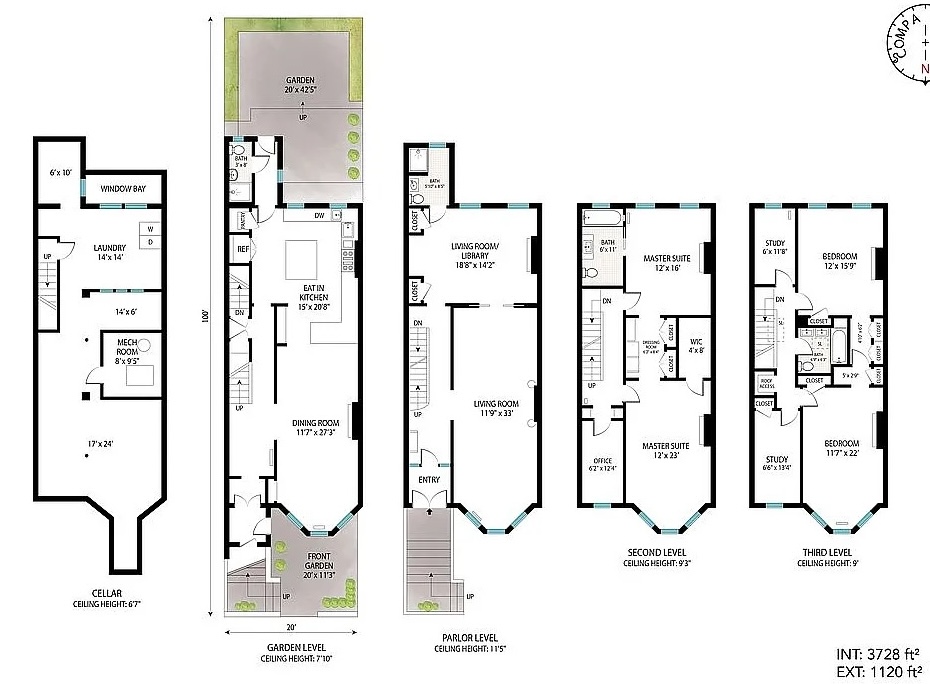
It sold last year for $2.9 million. However, the NYC Department of Finance assigns a “market value” of $2.05 million, based on “statistical modeling”. Based on this “market value” and the assessment ratios we saw earlier, the assessed value should be $122,940. Due to the 6%-per-year limit on changes to assessed value for 1-3 unit properties though, the taxable assessed value is just $32,704. On a house that just sold for $2.9 million.
With no exemptions or abatements, this assessed value is taxed at the class 1 rate of 19.84% for an annual tax bill of $6,489.48 or $1.74 per square foot. On the actual sale price, this is an effective tax rate of 0.22%.
1155 Bedford Ave #2R, a one bedroom condo
Now let’s take a look at a condo. Here’s 1155 Bedford Ave #2R, a 624 square foot one bedroom condo near Nostrand Ave on the A and C trains.
This condo sold in 2024 for $741,706, with a DOF assigned market value of $203,822. The DOF methodology for valuing condos and co-ops is based on estimated income if the building were rental housing, which is notorious for under-valuing condos. Unlike the single family home though, the assessed value is 45% of the market value, which more than cancels out this methodological difference to give an estimated $91,720 assessed value. Due to the (smaller) limitations on changes in assessed value, the actual taxable assessed value is $77,521 – more than twice that of the single-family home that is six times the size.
With no exemptions or abatements, this assessed value is taxed at the class 2 rate of 12.439% for an annual tax bill of $9,643, or $15.45 per square foot. Per square foot this is 9× the tax! The effective tax rate (based on the real sale price) is 1.30%, 6× the rate for 176 Mac Donough St.
Co-ops and rental apartment buildings, which make up a large amount of NYC’s housing stock, are slightly more difficult to pick apart, because the entire building only gets a single tax bill. But we can try.
372 Dekalb Ave #5M, a one bedroom co-op
372 Dekalb Ave #5M is a 625 square foot co-op unit which sold in November 2023 for $690,000 in a 78-unit, 89420 square foot building. The tax data for the entire 78-unit building shows that it has a “market value” of $12,003,000 (likely a huge under-estimate), an assessed value (45%) of $5,401,350 and a taxable assessed value of $4,859,100 (as a large building, there is no limit on increases, but changes are averaged over five years.)
There are no exemptions on this value, which leads to a computed tax (12.439%) of $604,423.45. There are some abatements, mostly those provided for an owner-occupied co-op, which reduce the tax bill by $86,824.56 to $517,598.89. This is $5.79 per square foot, over 3× the single-family home tax rate.
We don’t know how this co-op assigns taxes to individual unit owners, so we have to make an assumption. Assuming that the taxes are distributed proportionally to unit size, we have 625 sq ft / 89420 sq ft total, for an estimated per-unit tax of $3,617.75. This means that the effective tax rate is 0.52% – a lot better than the condo, but still over twice the single-family home.
267 Clifton Pl #D1, a two bedroom rental
Rental buildings are even more difficult, because we don’t have an equivalent sales price. But let’s take a look anyway at 267 Clifton Pl #D1, a 2-bedroom apartment which rented last December for $3600. The 20-unit, 17,600 square foot apartment building has a DOF-assigned “market value” of $2,770,000, with an assessed value (45%) of $1,246,500 and a taxable assessed value of $1,199,250.
With no exemptions or abatements, this leads to a $149,174.71 annual tax bill, or $8.48 per square foot. Like with the co-op building, we don’t really know how this tax is distributed among the units, but if we estimate an even split, that leads to an estimated per-unit tax of $7,459. The tenant of this two-bedroom apartment is paying more tax than the owner of the six bedroom brownstone.
Let’s summarize this in a table.
176 Mac Donough St
Single-family, 3,728 sq ft
1155 Bedford Ave #2R
Condo, 624 sq ft
372 Dekalb Ave #5M
Co-op, ~625 sq ft
267 Clifton Pl #D1
Rental 2BR, ~880 sq ft
Sale price
NYC "market value" methodology
Comparable sales
(71% of sale)
Modeled as rental
(27% of sale)
Modeled as rental
(building)
"Market value"
$2,050,000
$203,822
Assessment ratio
Assessed value
= $122,940
= $91,720
Transitional value caps
6%/year or 20%/5 years
Class 1
5-yr average
Class 2 (> 10 units)
5-yr average
Class 2 (> 10 units)
5-year average
Class 2 (> 10 units)
Taxable assessed
$32,704
$77,521
Exemptions
− $0
− $0
− $0
− $0
Taxable after exemptions
= $32,704
= $77,521
Tax rate
Tax before abatements
= $6,489
= $9,643
Abatements
− $0
− $0
− $86,825
owner-occupied co-op
− $0
Unit ratio estimation
× (625 sq ft / 89420 sq ft)
/ 20 units
Annual tax
Effective tax rate
0.22%
1.30%
0.52%
Tax per sq ft
Tax policy hacks
This looks to me like an unjustifiable tax regime that penalizes large residential buildings in the densest city in the United States. Naturally, this has led to housing market issues, including depressing new housing construction. To compensate for this, the city has a number of tax policy schemes that provide exemptions and abatements, including the J-51 abatement that provides a discounted tax bill on recently renovated or expanded apartment buildings, and the 421-a exemption, that removes up to 100% of a newly constructed building’s value from the taxroll. These tax discounts are provided to developers in exchange for allocating a percentage of a building’s unit as below-market-rate rentals and/or putting their units into the rent stabilization program, often for a limited timespan. The 421-a program has ended, but it was replaced with a similar program called 485-x.
This means that many new market-rate rentals have a significant tax advantage over older buildings. Is this unfair? In practice, what this often does is bring the taxation of multi-family buildings into closer alignment with small/single-family houses. Let’s compare a few more homes.
283 Decatur St
Single-family, 3,352 sq ft
191 Spencer St #2A
Condo, 1,041 sq ft
297 Classon Ave #3R
Co-op, 700 sq ft
1134 Fulton St #10WW
Rental, 850 sq ft
Sale price
$3,400,000
$1,100,000
$825,000
NYC "market value" methodology
Comparable sales
(56% of sale)
Modeled as rental
(21% of sale)
Modeled as rental
(building)
"Market value"
$1,893,000
$231,740
Assessment ratio
Assessed value
= $113,580
= $104,283
Transitional value caps
6%/year or 20%/5 years
Class 1
5-yr average
Class 2 (> 10 units)
8%/year or 30%/5 years
Class 2C (≤ 10 units)
5-yr average
Class 2 (> 10 units)
Taxable assessed
$33,792
$98,260
Exemptions
− $0
− $9,955
Combat Vet + STAR
Taxable after exemptions
= $33,792
= $19,766
Tax rate
Tax before abatements
= $6,705
= $2,459
Abatements
− $0
− $0
− $1,076
owner-occupied co-op
− $0
Unit ratio estimation
× (700 sq ft / 8417 sq ft)
/ 182 units
Annual tax
= $6,705
= $2,459
Effective tax rate
0.20%
0.22%
0.30%
Tax per sq ft
Note that 1134 Fulton St, with its almost-complete 421-a tax exemption, pays the smallest per-square-foot tax of any of the eight homes. Again though, we don’t know how the owner chooses to allocate/budget the tax bills – and since the building has commercial tenants as well, their rent could even carry the bulk of the tax cost, making the apartments effectively tax-free for the landlord.
None of these properties, even the multi-million dollar brownstone purchased by a holding company as a New York-crashpad for a California-based supermodel, would be subject to the pied-a-terre tax, at least during Phase 1. Eventually (2028–) there will be changes to the computation of market value that might make more condos subject to the tax, but is unlikely to affect single-family houses.
The whole system feels deeply arbitrary, with stacked layers of policy hacks (market value determination methodology differences, assessment ratios, increase caps, tax abatement programs, etc.) that attempt to smooth out what is actually a deeply lumpy, inequitable reality. I’m hardly the first one to notice this, and there have been multiple attempts to reform New York City’s property tax system. However, as many vested interests have carved out something that works for them, headwinds are strong.
Maybe I’ve made a mistake in interpretation or understanding here. If so, please tell me. I’m not an expert in property taxes, I’ve just tried to piece together what I’ve read about with what the data shows. I suspect my largest error is having any expectation that the property tax system would be simple or equitable to begin with.