Back Original

Qwen3.8 27B addition in words

Research Qwen3.8 27B addition in words — A benchmark tested whether the local `Qwen3.8-27B-Q4_K_M.gguf` model could add positive integers and express exact results solely in English words, using 5,070 reasoning-disabled cases and a paired 169-case comparison with medium reasoning. Without reasoning, it achieved 23.57% numeric accuracy, with performance dropping from 97.04% for one- to three-digit operands to 6.44% for ten- to thirteen-digit operands, despite 96.17% format compliance.

Colin Frasier posted on Bluesky about an experiment he ran over two years ago using GPT-4o to see how well it could "compute the sum but return the answer in words" across increasingly large numbers. Here's the chart he shared of those results:
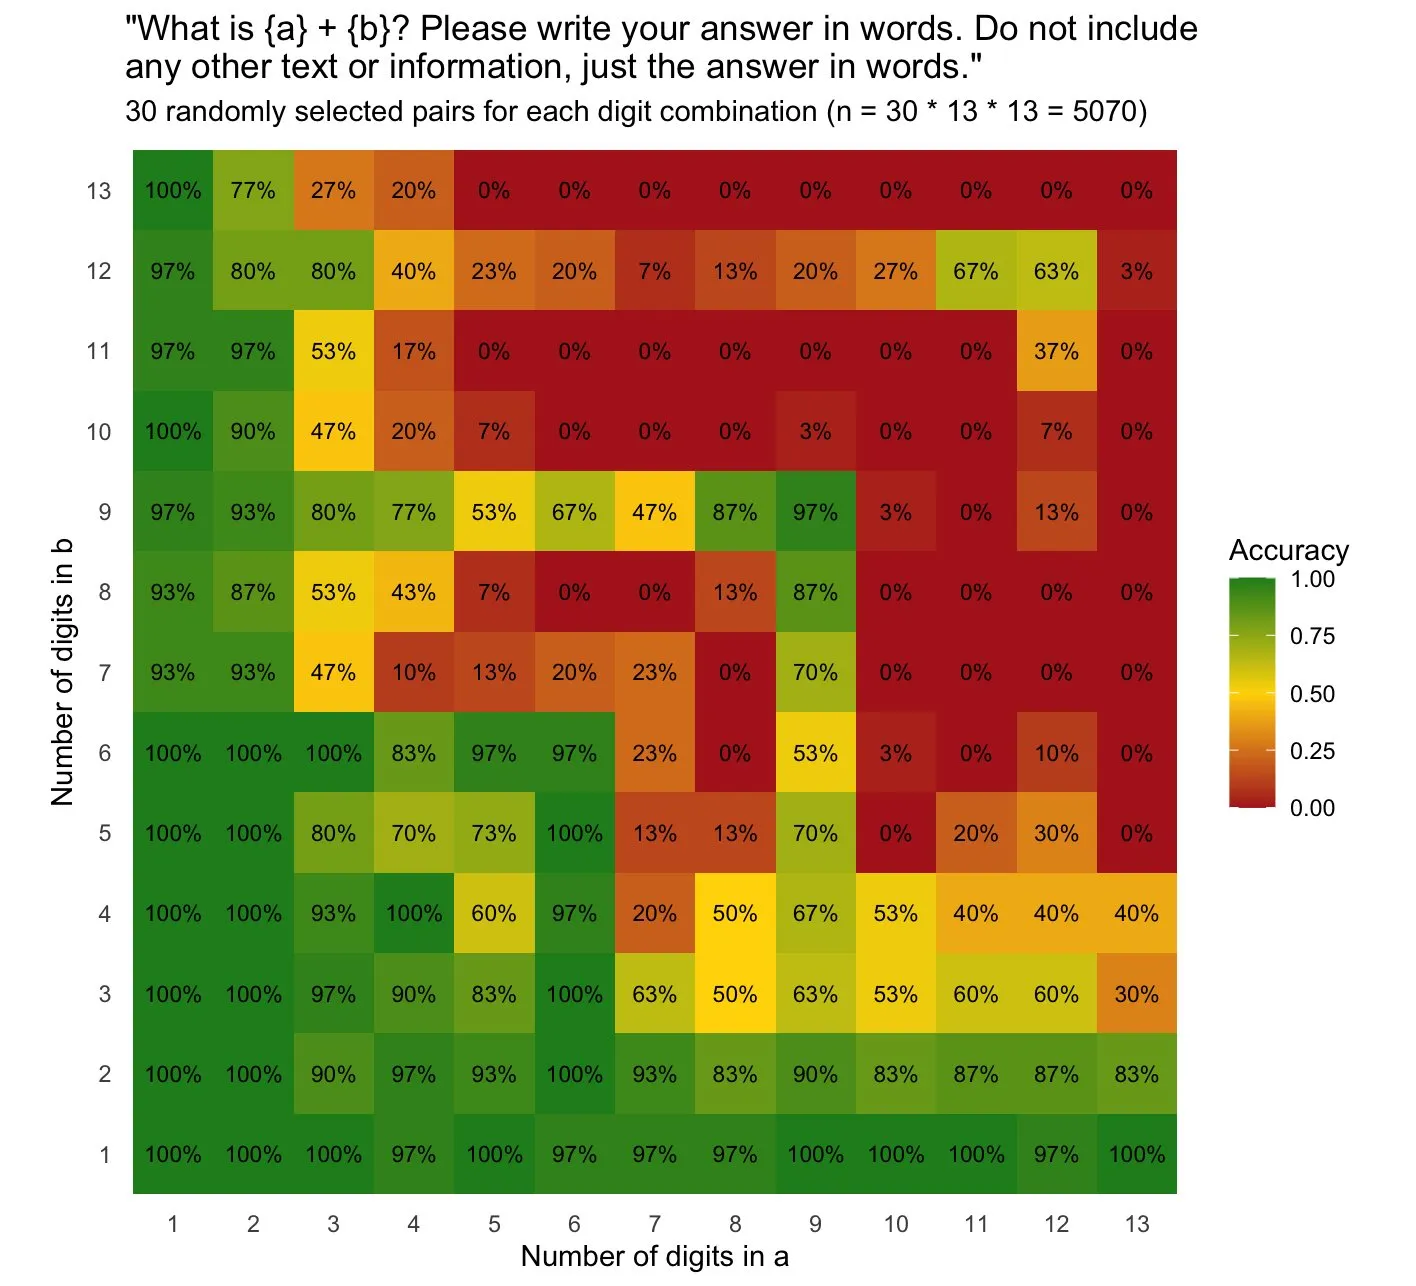
Heatmap chart of accuracy on an addition prompt, colored from dark green (high) through yellow to dark red (low). Title: "What is {a} + {b}? Please write your answer in words. Do not include any other text or information, just the answer in words." Subtitle: 30 randomly selected pairs for each digit combination (n = 30 * 13 * 13 = 5070). X axis: Number of digits in a, 1 to 13. Y axis: Number of digits in b, 1 to 13. Legend: Accuracy, 1.00, 0.75, 0.50, 0.25, 0.00. Values by row, listed for a = 1 to 13. b = 13: 100%, 77%, 27%, 20%, 0%, 0%, 0%, 0%, 0%, 0%, 0%, 0%, 0%. b = 12: 97%, 80%, 80%, 40%, 23%, 20%, 7%, 13%, 20%, 27%, 67%, 63%, 3%. b = 11: 97%, 97%, 53%, 17%, 0%, 0%, 0%, 0%, 0%, 0%, 0%, 37%, 0%. b = 10: 100%, 90%, 47%, 20%, 7%, 0%, 0%, 0%, 3%, 0%, 0%, 7%, 0%. b = 9: 97%, 93%, 80%, 77%, 53%, 67%, 47%, 87%, 97%, 3%, 0%, 13%, 0%. b = 8: 93%, 87%, 53%, 43%, 7%, 0%, 0%, 13%, 87%, 0%, 0%, 0%, 0%. b = 7: 93%, 93%, 47%, 10%, 13%, 20%, 23%, 0%, 70%, 0%, 0%, 0%, 0%. b = 6: 100%, 100%, 100%, 83%, 97%, 97%, 23%, 0%, 53%, 3%, 0%, 10%, 0%. b = 5: 100%, 100%, 80%, 70%, 73%, 100%, 13%, 13%, 70%, 0%, 20%, 30%, 0%. b = 4: 100%, 100%, 93%, 100%, 60%, 97%, 20%, 50%, 67%, 53%, 40%, 40%, 40%. b = 3: 100%, 100%, 97%, 90%, 83%, 100%, 63%, 50%, 63%, 53%, 60%, 60%, 30%. b = 2: 100%, 100%, 90%, 97%, 93%, 100%, 93%, 83%, 90%, 83%, 87%, 87%, 83%. b = 1: 100%, 100%, 100%, 97%, 100%, 97%, 97%, 97%, 100%, 100%, 100%, 97%, 100%.

I'm confident GPT-4o didn't cheat and use a calculator, especially since it got so many of the calculations wrong, but I was inspired to run the experiment again on local hardware (a DGX Spark) to explore the effect in a fully controlled environment.

I pasted his image into a Codex Remote session (GPT-6 Astra) and had it run the same experiment using Qwen3.8-27B-Q4_K_M.gguf. Here's the result for a run of 30 attempts per combination with reasoning disabled:
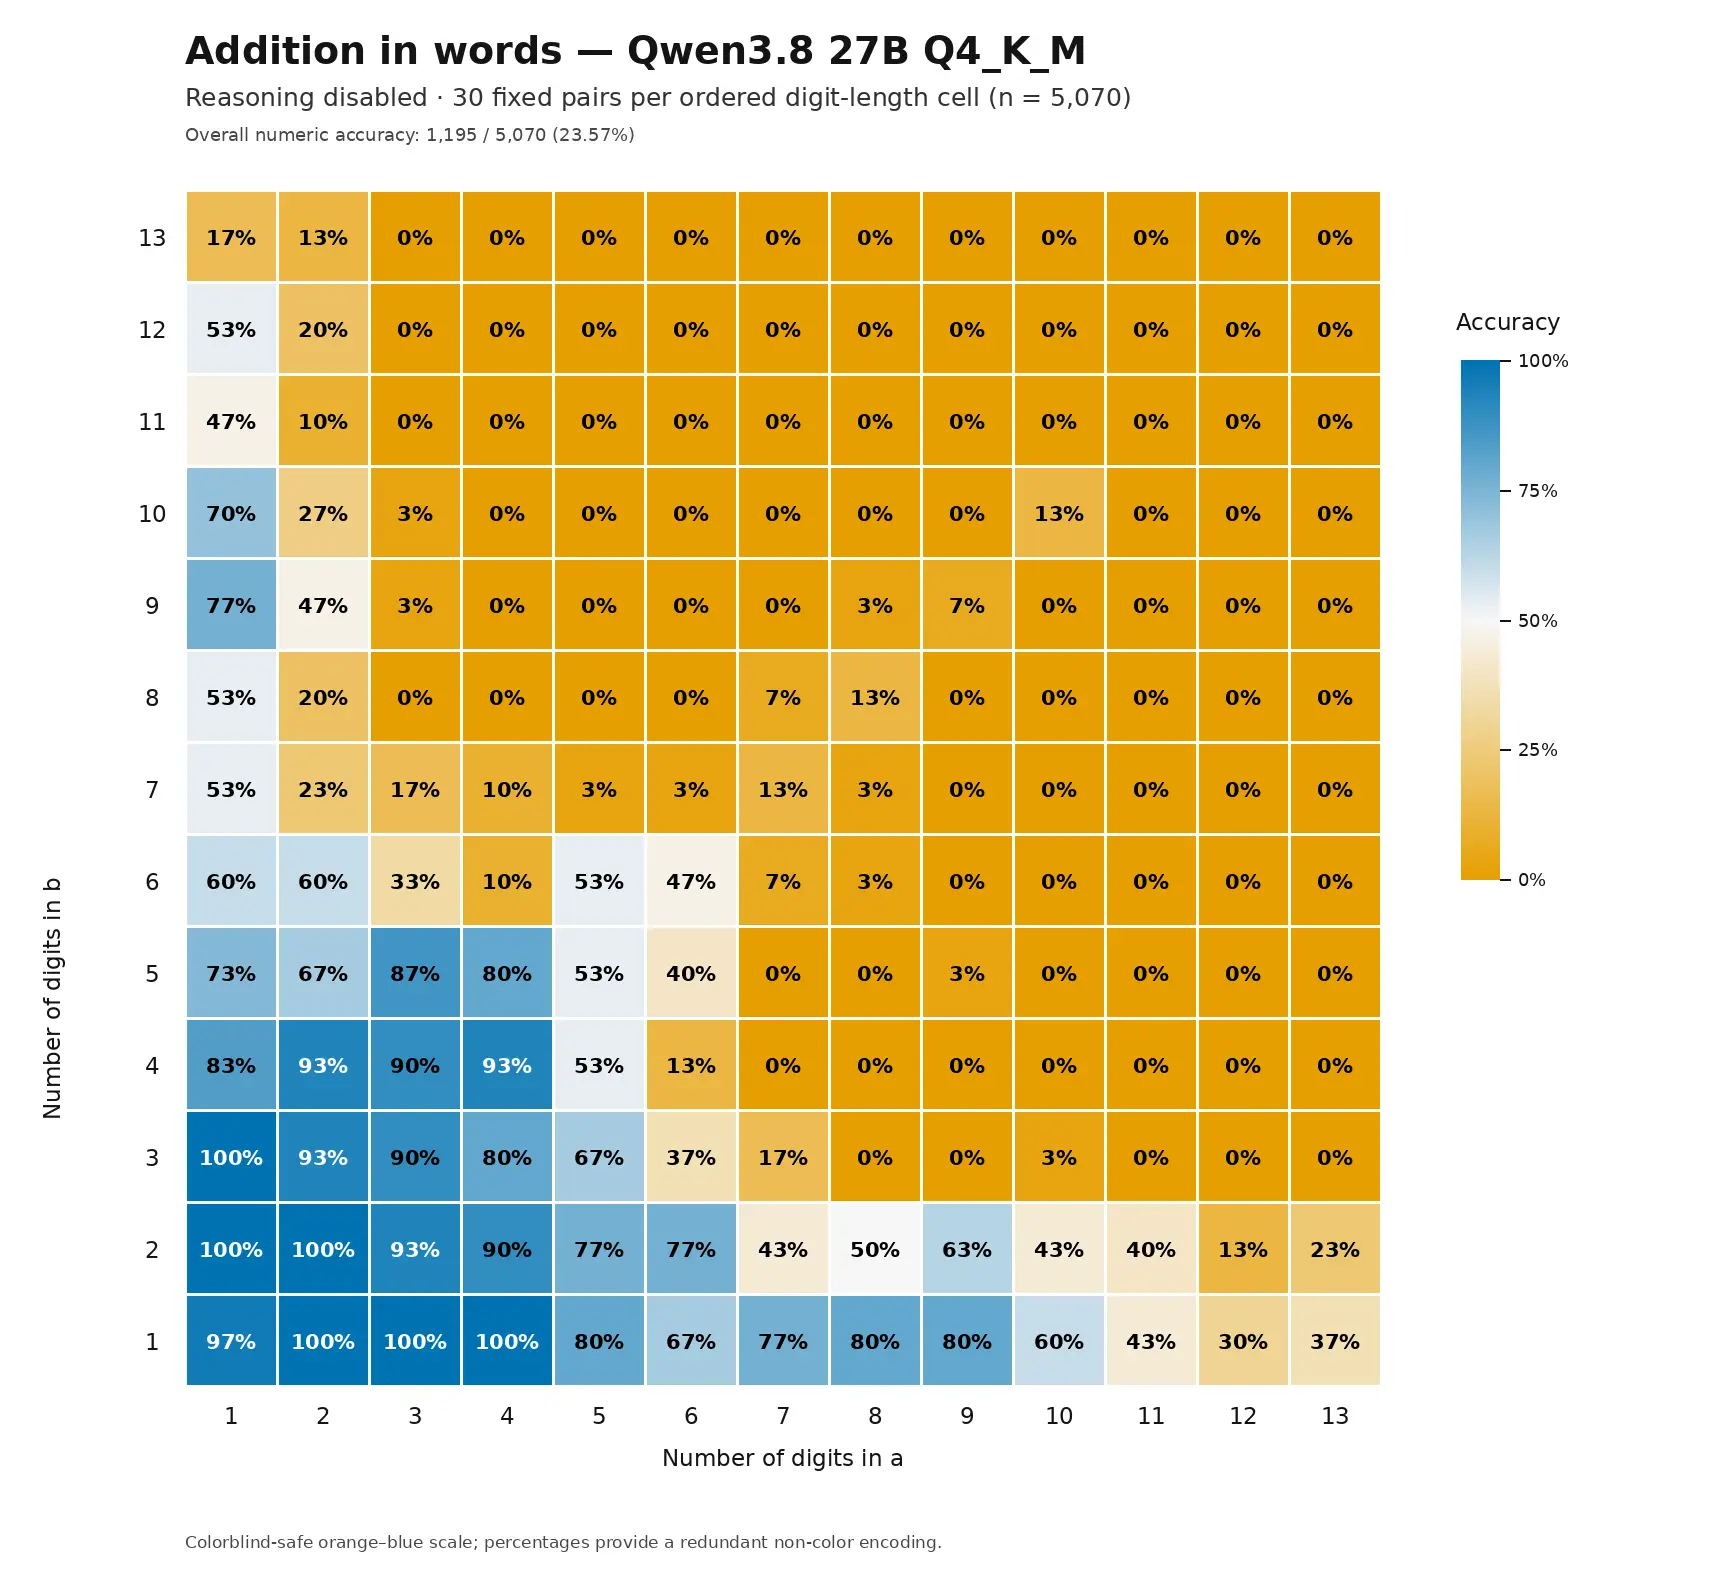
Heatmap in the same layout as the previous chart, using an orange (low) to white to blue (high) color scale, showing much lower accuracy overall. Title: Addition in words — Qwen3.8 27B Q4_K_M. Subtitle: Reasoning disabled · 30 fixed pairs per ordered digit-length cell (n = 5,070). Overall numeric accuracy: 1,195 / 5,070 (23.57%). X axis: Number of digits in a, 1 to 13. Y axis: Number of digits in b, 1 to 13. Legend: Accuracy, 100%, 75%, 50%, 25%, 0%. Values by row, listed for a = 1 to 13. b = 13: 17%, 13%, 0%, 0%, 0%, 0%, 0%, 0%, 0%, 0%, 0%, 0%, 0%. b = 12: 53%, 20%, 0%, 0%, 0%, 0%, 0%, 0%, 0%, 0%, 0%, 0%, 0%. b = 11: 47%, 10%, 0%, 0%, 0%, 0%, 0%, 0%, 0%, 0%, 0%, 0%, 0%. b = 10: 70%, 27%, 3%, 0%, 0%, 0%, 0%, 0%, 0%, 13%, 0%, 0%, 0%. b = 9: 77%, 47%, 3%, 0%, 0%, 0%, 0%, 3%, 7%, 0%, 0%, 0%, 0%. b = 8: 53%, 20%, 0%, 0%, 0%, 0%, 7%, 13%, 0%, 0%, 0%, 0%, 0%. b = 7: 53%, 23%, 17%, 10%, 3%, 3%, 13%, 3%, 0%, 0%, 0%, 0%, 0%. b = 6: 60%, 60%, 33%, 10%, 53%, 47%, 7%, 3%, 0%, 0%, 0%, 0%, 0%. b = 5: 73%, 67%, 87%, 80%, 53%, 40%, 0%, 0%, 3%, 0%, 0%, 0%, 0%. b = 4: 83%, 93%, 90%, 93%, 53%, 13%, 0%, 0%, 0%, 0%, 0%, 0%, 0%. b = 3: 100%, 93%, 90%, 80%, 67%, 37%, 17%, 0%, 0%, 3%, 0%, 0%, 0%. b = 2: 100%, 100%, 93%, 90%, 77%, 77%, 43%, 50%, 63%, 43%, 40%, 13%, 23%. b = 1: 97%, 100%, 100%, 100%, 80%, 67%, 77%, 80%, 80%, 60%, 43%, 30%, 37%. Footnote: Colorblind-safe orange–blue scale; percentages provide a redundant non-color encoding.

Then I ran it again with reasoning enabled. This took a lot longer per pair, so instead of running 30 samples per square I ran just one - which results in a much less visually appealing heatmap since each square is either 100% or 0%:
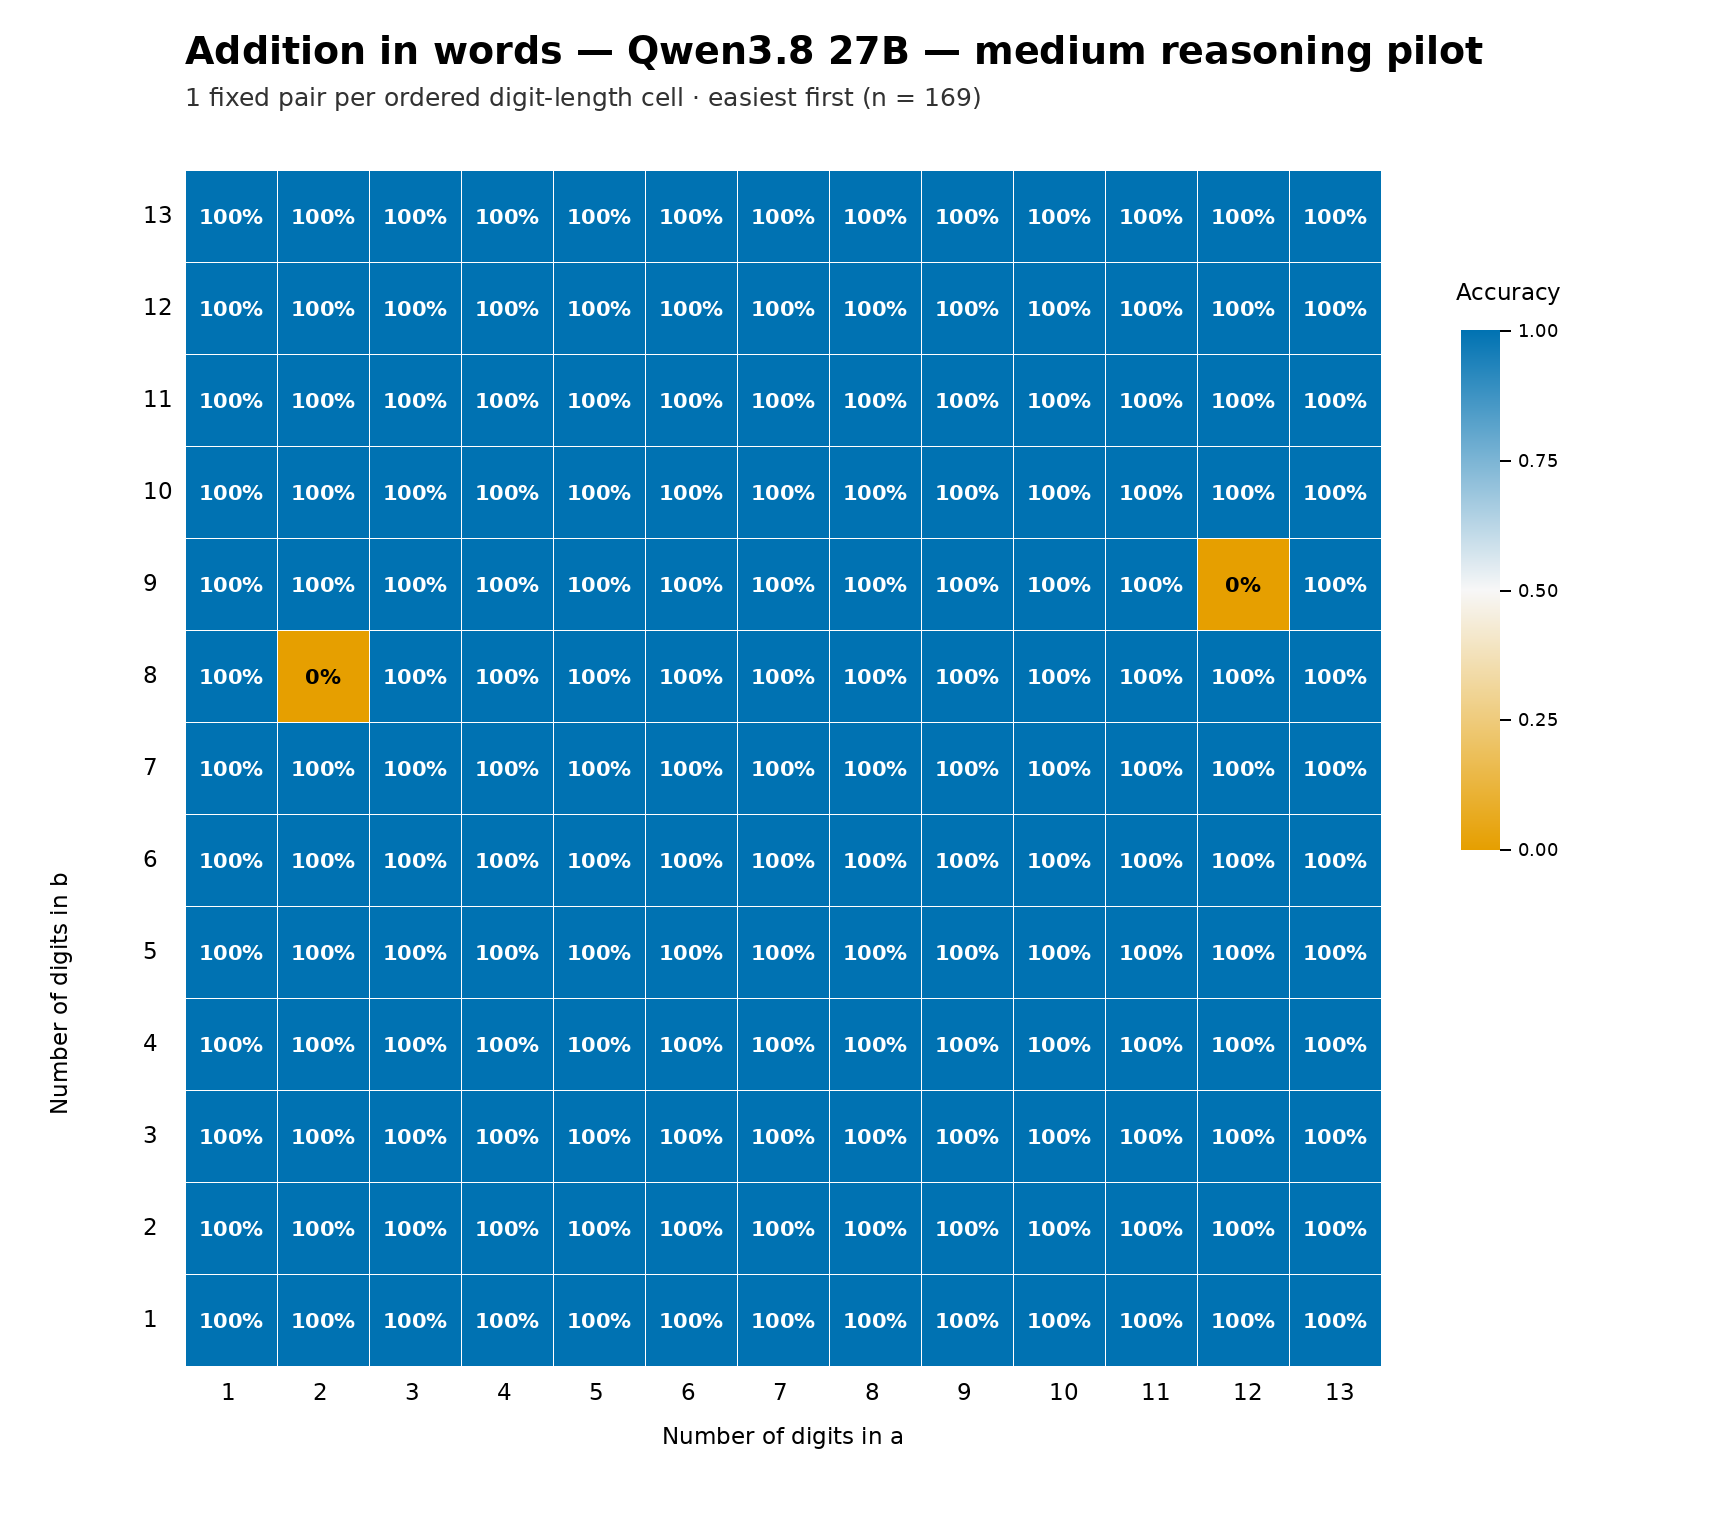
Heatmap in the same layout as the previous charts, almost entirely blue. Title: Addition in words — Qwen3.8 27B — medium reasoning pilot. Subtitle: 1 fixed pair per ordered digit-length cell · easiest first (n = 169). X axis: Number of digits in a, 1 to 13. Y axis: Number of digits in b, 1 to 13. Legend: Accuracy, 1.00, 0.75, 0.50, 0.25, 0.00. Every cell shows 100% except two orange cells showing 0%: a = 2 with b = 8, and a = 12 with b = 9.

It got the right answer in 167 out of 169 attempts, and since these were one-shot I'm confident a second run would produce different results here.

Here's a version of the report that includes the reasoning traces from some of those larger calculations, which include text like this:

Wait, let me redo this more carefully.

4,299,366,105,622
6,088,794,067,970

Let me align them:
4 2 9 9 3 6 6 1 0 5 6 2 2
6 0 8 8 7 9 4 0 6 7 9 7 0

Adding from right to left:
Position 1 (units): 2 + 0 = 2
Position 2 (tens): 2 + 7 = 9
Position 3 (hundreds): 6 + 9 = 15, write 5, carry 1