TL;DR: Coding agents generate better optimizations when they read papers and study competing projects before touching code. We added a literature search phase to the autoresearch / pi-autoresearch loop, pointed it at llama.cpp with 4 cloud VMs, and in ~3 hours it produced 5 optimizations that made flash attention text generation +15% faster on x86 and +5% faster on ARM (TinyLlama 1.1B). The full setup works with any project that has a benchmark and test suite.
Key takeaways:
- Agents that read papers and study competing projects before writing code find optimizations that code-only agents miss. The literature research pointed the agent at operator fusions present in CUDA/Metal backends but absent from CPU.
- 5 of 30+ experiments landed: 4 kernel fusions and an adaptive parallelization. The biggest win fused three passes over flash attention’s QK tile into a single AVX2 FMA loop.
- Studying forks and other backends was more productive than searching arxiv. ik_llama.cpp and the CUDA backend directly informed two of the five final optimizations.
- Total cost: ~$29 ($20 in CPU VMs, $9 in API calls) over ~3 hours with 4 VMs.
Where code-only context works
Karpathy’s autoresearch showed that a coding agent can autonomously improve a neural network training script. In our previous post, we scaled that to 16 GPUs and watched the agent run ~910 experiments in 8 hours, driving val_bpb down 2.87%. The agent brainstormed ideas from code context alone, and the experiments were all variations on the same train.py.
Since then, pi-autoresearch generalized the loop into a reusable extension for any benchmarkable target. Shopify CEO Tobi Lütke ran it on Liquid, the Ruby template engine that processes $292B in annual merchandise volume. The agent ran ~120 experiments, producing 93 commits that cut parse+render time by 53% and allocations by 61% with zero regressions across 974 unit tests (Simon Willison’s writeup, Tobi’s post).
In that case, the optimization surface was visible in the source. The Liquid agent could read the tokenizer, see that StringScanner was the bottleneck, and brainstorm alternatives from the codebase alone.
Where code-only context breaks down
Not every optimization problem works this way. A codebase tells you what the code does, but not why it’s slow or what alternatives exist outside of this codebase. When the answer lives outside the source (in arxiv papers, in competing projects, e.g. in the domain knowledge a senior engineer would bring), an agent working from code alone will generate shallow hypotheses.
We saw this when we pointed the agent at llama.cpp’s CPU inference path. The optimization search space isn’t “try a different learning rate.” It’s “should I fuse these two memory passes?”, “is this workload compute-bound or memory-bound?”, “what has ik_llama.cpp already tried?”
The agent’s first wave of experiments showed the problem. Working from code context alone, it went straight for SIMD micro-optimizations in the quantized dot products that sit in GGML’s matrix multiplication hot path. It tried:
- AVX2 prefetching in the Q4_0 dot product inner loop (+0.8%)
- 2x loop unrolling with dual accumulators (+0.9%)
- Eliminating a temporary buffer in
mul_mat(-2.8%, regression) - Hoisting block boundary calculations (+0.6%)
All within noise. The agent’s postmortem:
“Wave 1 results show that micro-optimizations in the compute path give negligible returns because text generation is memory-bandwidth bound, not compute bound.”
A 606 MiB model at ~49 tokens/s consumes ~30 GB/s of memory bandwidth, close to the c6i.2xlarge’s DRAM limit. No amount of SIMD tricks will help when the CPU is stalled waiting for model weights to arrive from DRAM. But the code alone doesn’t tell you this. You need to know the memory bandwidth of the target hardware, understand the roofline model, and recognize that batch-size-1 inference is memory-bound. That’s domain knowledge the agent didn’t have.
Adding a research phase
If the bottleneck is hypothesis quality, give the agent better inputs. Before running any experiments, have it read papers, study forks, and look at what other projects have already tried. The same preparation a senior engineer would do before touching unfamiliar code.
The original autoresearch loop is: edit code -> run experiment -> check metric -> keep or discard. pi-autoresearch generalized this to any project with a benchmarkable metric. Our version builds on that and adds a research step and parallel cloud execution:
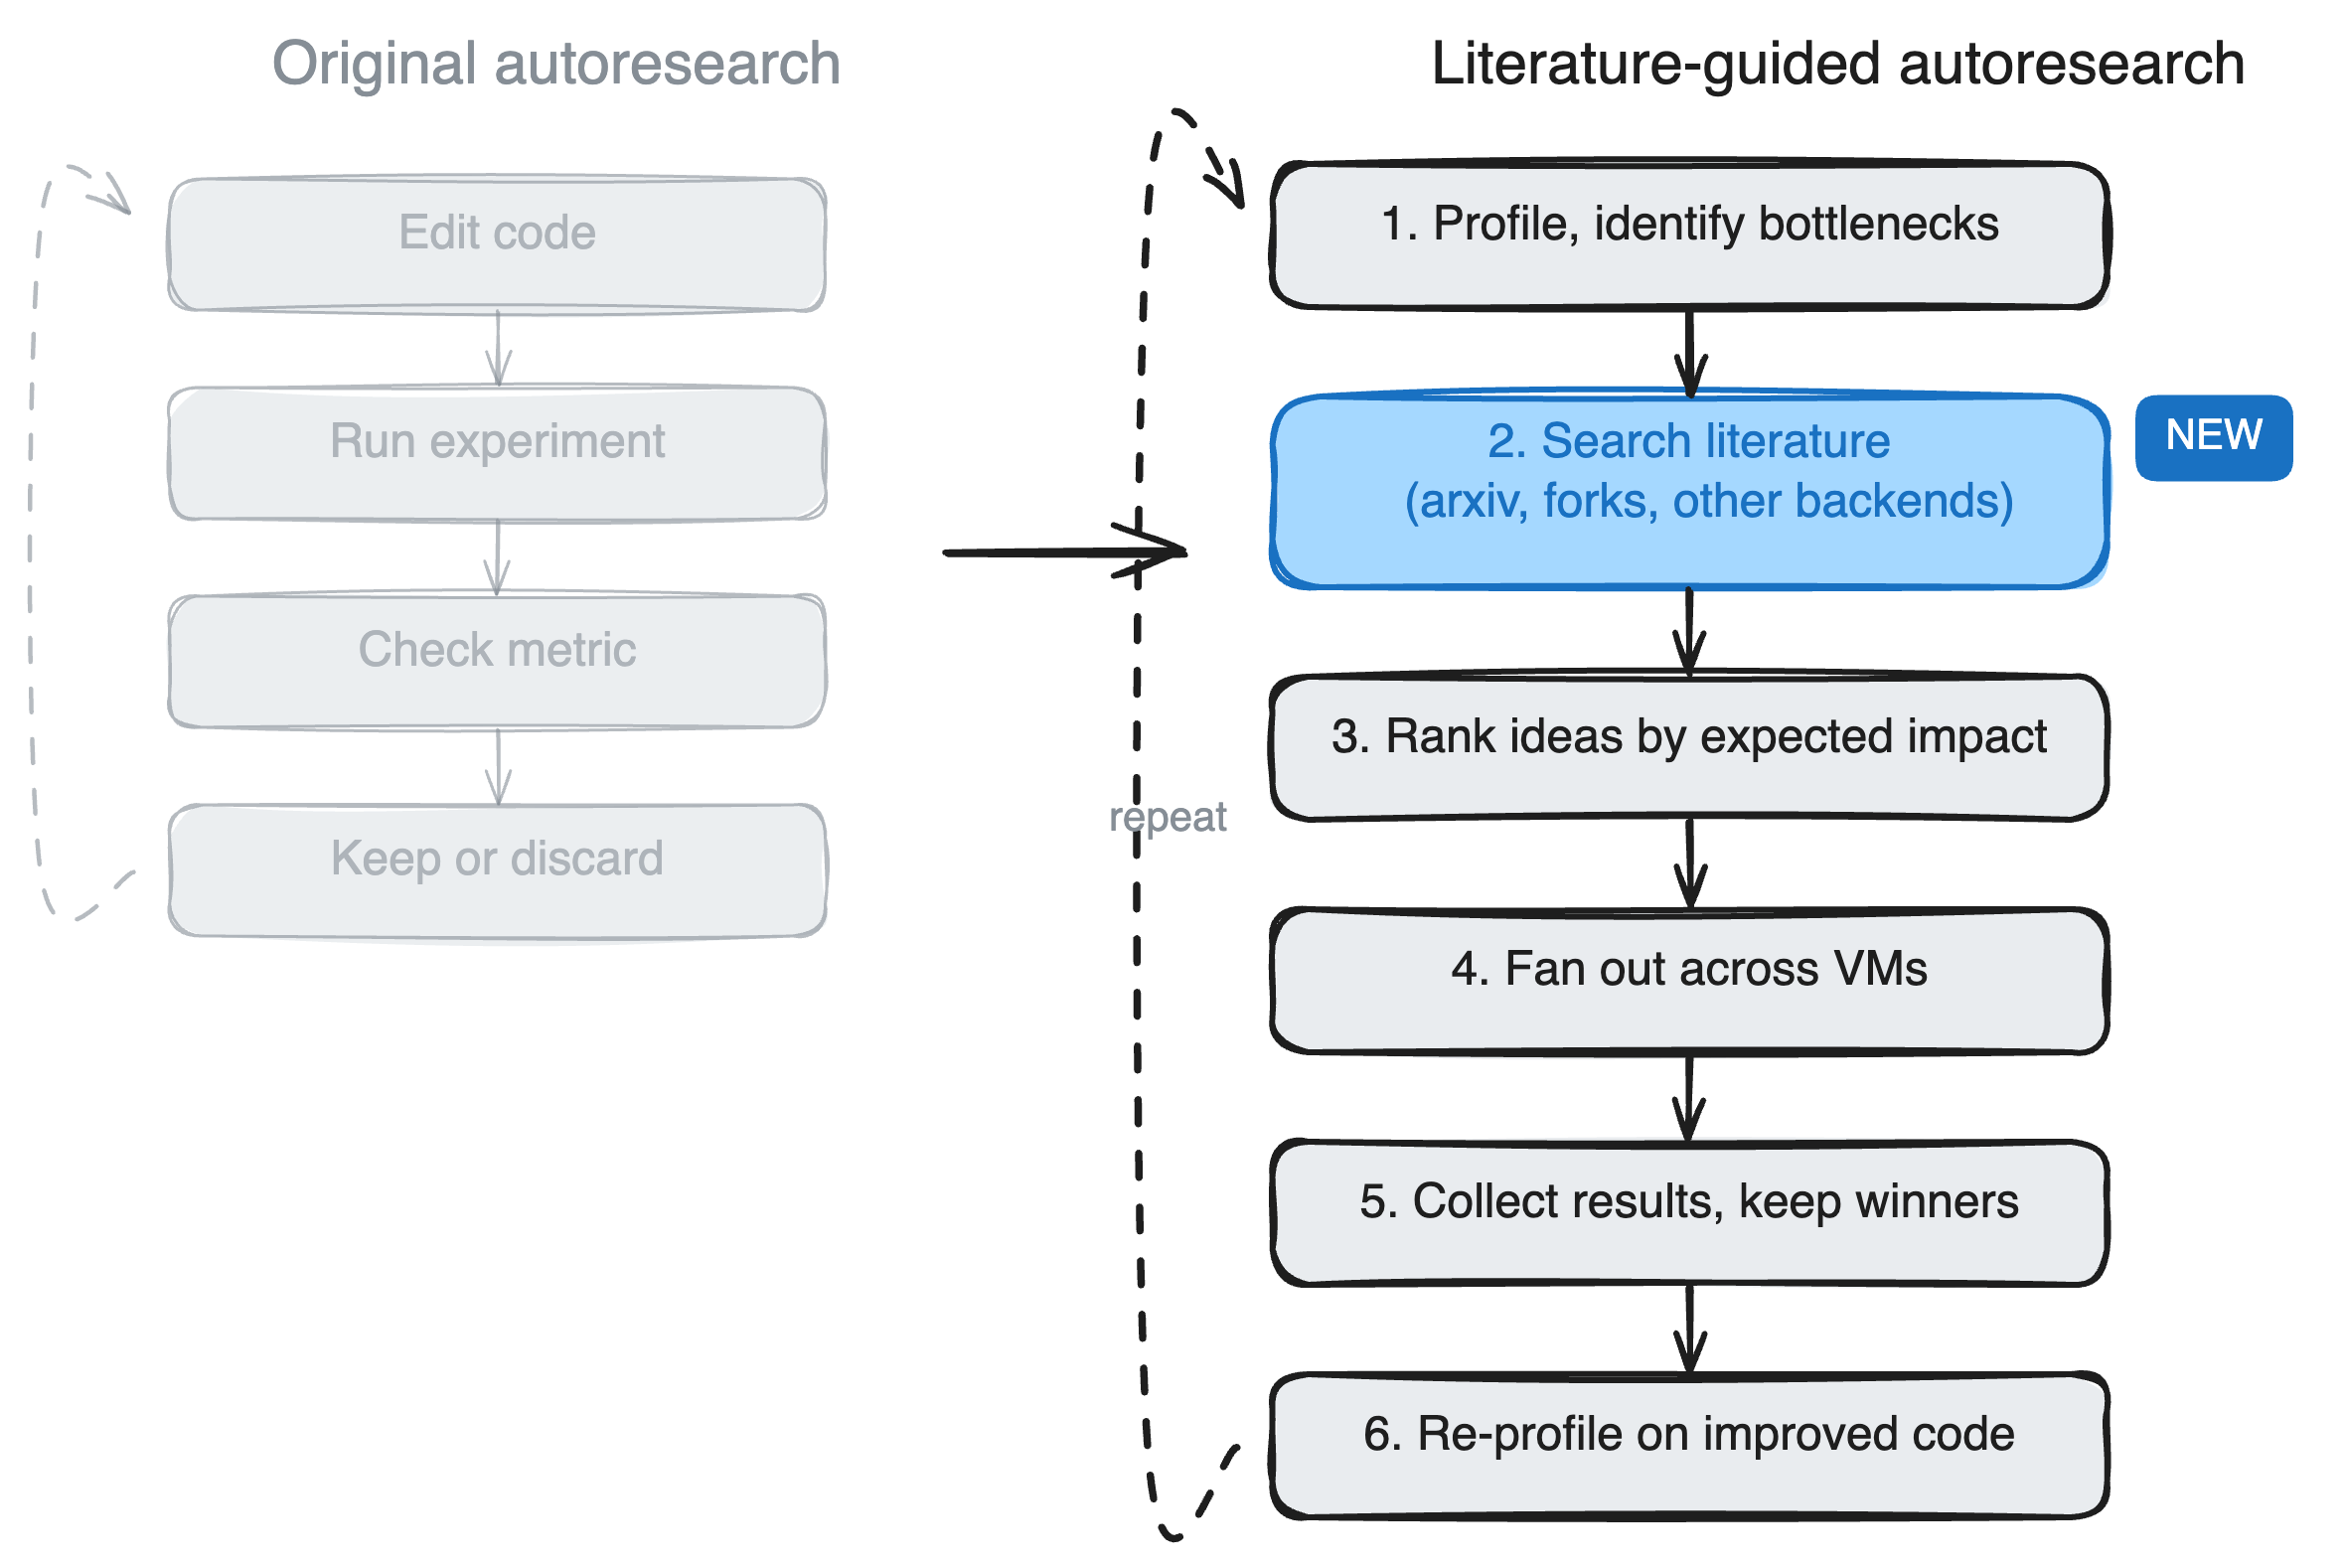
The agent writes its own benchmark script (autoresearch.sh) and correctness checks (autoresearch.checks.sh), then uses SkyPilot to fan out experiments across cloud VMs. Each experiment runs on its own VM: build the project, run the benchmark, run correctness checks, report metrics. The agent checks results via sky logs, commits winners, and queues the next wave.
experiment.yaml: SkyPilot task template for one experiment
resources:
  cpus: 4+
  memory: 8+

workdir: .

envs:
  EXPERIMENT_ID: baseline
  EXPERIMENT_DESC: "baseline measurement"
  BUILD_CMD: "make -j$(nproc)"
  BENCH_TIMEOUT: 300
  CHECK_TIMEOUT: 300

setup: |
  cd ~/sky_workdir
  if [ -f setup_deps.sh ]; then
    bash setup_deps.sh
  else
    eval "${BUILD_CMD}"
  fi

run: |
  cd ~/sky_workdir
  # Build, benchmark, run checks, report METRIC lines
  eval "${BUILD_CMD}" 2>&1 | tail -30
  BENCH_OUTPUT=$(timeout "${BENCH_TIMEOUT}" bash autoresearch.sh 2>&1)
  echo "$BENCH_OUTPUT"
  # ... extract METRIC lines, run autoresearch.checks.sh ...
  echo "EXPERIMENT_STATUS: done"
No GPU needed for CPU-bound code optimization. Override with --gpus if your target needs GPU benchmarking.
The experiment log
We pointed Claude Code at llama.cpp, gave it 4 AWS VMs via SkyPilot, and told it to make CPU inference faster.
Target: CPU inference throughput for TinyLlama 1.1B (Q4_0 quantization), benchmarked on two architectures:
- x86: AWS c6i.2xlarge (Intel Xeon Ice Lake, 8 vCPUs, AVX-512)
- ARM: AWS c7g.2xlarge (Graviton3, 8 vCPUs, NEON)
Metric: tokens/second for prompt processing (pp) and text generation (tg), measured with llama-bench -p 512 -n 128 -t 8 -r 5.
It started with 4 x86 VMs to establish baselines and run experiments. Later it provisioned ARM VMs to check portability; each kernel fusion includes both AVX2/FMA and NEON paths, with scalar fallbacks.
What the research turned up
Between experiment waves, the agent ran two parallel research threads:
- Competing projects: ik_llama.cpp (a performance-focused fork), llamafile’s tinyBLAS, PowerInfer, ExLlamaV2 (the author of this post wasn’t even aware of some of these projects)
- Arxiv papers: FlashAttention (IO-aware tiled attention), Blockbuster (block-level operator fusion), LLM Inference Acceleration via Efficient Operation Fusion, Online normalizer calculation for softmax, Inference Performance Optimization for Large Language Models on CPUs (Intel’s cache-aware thread partitioning)
The top findings:
- ik_llama.cpp’s row-interleaved quantization repacking gave 2.9x PP improvement. It was already upstreamed to mainline llama.cpp via the
Q4_0_8x8repack format. The agent confirmed it was active in the benchmark. - The Blockbuster paper proposes fusing the entire FFN block (RMSNorm + gate matmul + up matmul + SwiGLU + down matmul) into a single cache-resident tiled pass. The agent tried to implement it but the weight matrices are quantized (
Q4_0_8x8), andggml_concatdoesn’t work with repacked quantized tensors. Proper implementation requires model loader changes. - The agent checked whether the c6i.2xlarge’s AVX-512 support was being used. It was.
-march=nativeenables it via compiler preprocessor macros, despite the CMake variable showingGGML_AVX512=OFF(which only affects MSVC builds). - Merged gate+up weights (PR #19139) concatenate the gate and up projection weight matrices to eliminate one activation load per FFN block. This gave +12% PP for MoE models but isn’t yet implemented for dense models.
The fork analysis was more useful than the arxiv search. Several actionable ideas came from studying what ik_llama.cpp and llamafile had already shipped. Studying the CUDA and Metal backends also directly led to optimization #4 below: the agent noticed that RMS_NORM + MUL fusion existed in every backend except CPU.
The pivot: from compute to memory
After Wave 1’s failures, the agent changed direction:
“I need to pivot to optimizations that reduce memory traffic or improve memory access patterns.”
Matmul accounts for ~95% of inference time, so the remaining operations (softmax, RMS norm, quantization) only leave ~5% headroom. But those operations are small enough to be compute-bound rather than memory-bound, so reducing memory passes within them can help.
Optimizations that landed
Five out of 30+ experiments made it into the final code. Each one targets a different part of the non-matmul overhead:
1. Softmax fusion
The existing code did copy -> scale -> add mask in three separate passes over the data. The agent fused them into one:
// Before: 3 passes
memcpy(wp, sp, nc * sizeof(float));      // pass 1: copy
ggml_vec_scale_f32(nc, wp, scale);        // pass 2: scale
ggml_vec_add_f32(nc, wp, wp, mp_f32);     // pass 3: add mask

// After: 1 pass
for (int i = 0; i < nc; i++) {
    wp[i] = sp[i] * scale + mp_f32[i];
}
2. RMS norm fusion
Same pattern. The original did memcpy(y, x) then ggml_vec_scale_f32(y, scale) as two passes. Fused into y[i] = x[i] * scale in one pass.
3. Adaptive from_float parallelization
The from_float quantization loop (converting activations to the dot product input format) used a one-size-fits-all parallelization strategy. It now partitions by row when there are many rows (prompt processing) and by element when there are few (text generation).
Verified via clean A/B comparison on the same VM (without flash attention, to isolate the effect of these three changes):
| pp (tokens/s) | tg (tokens/s) | |
|---|---|---|
| Baseline | 210.65 ± 0.64 | 48.90 ± 0.50 |
| Optimized | 215.97 ± 1.52 | 49.33 ± 0.37 |
| Change | +2.5% | +0.9% |
Text generation barely changed, as expected: TG is memory-bandwidth bound (as described in Wave 1 above) and these changes don’t touch the matmul path. Prompt processing gained +2.5% because PP is compute-bound and benefits from fewer memory passes.
4. Graph-level RMS_NORM + MUL fusion
This one came directly from the research phase. While studying how other backends handle the same operations, the agent spotted a gap:
“RMS norm + MUL fusion doesn’t exist for the CPU backend, it’s only in CUDA. Instead of doing RMS norm (read x, compute sum, write y=x*scale) then MUL (read y, read weights, write y=y*weights), we do it in one pass: y = x * scale * weights.”
The CUDA and Metal backends already fuse these, but the CPU backend didn’t. The agent would not have looked for this without studying other backends during the research phase. From the CPU code alone, the two-step approach looks fine.
It implemented pattern detection in the CPU graph execution loop. When it sees RMS_NORM followed by MUL where the MUL’s input is the RMS_NORM output, it calls a fused kernel that computes y = x * (1/sqrt(mean_sq + eps)) * weights in a single pass with explicit AVX2 and NEON intrinsics:
// Fused RMS norm + multiply (AVX2 path)
__m256 vscale = _mm256_set1_ps(scale);
for (; i + 7 < ne; i += 8) {
    __m256 vx = _mm256_loadu_ps(x + i);
    __m256 vw = _mm256_loadu_ps(w + i);
    _mm256_storeu_ps(y + i, _mm256_mul_ps(_mm256_mul_ps(vx, vw), vscale));
}
The first version didn’t help, and the agent figured out why:
“The fusion saves one memory pass but the fused scalar loop is slower than the original SIMD-optimized separate passes. The original code used
memcpy(highly optimized) +ggml_vec_scale_f32(SIMD) +binary_op<op_mul>(SIMD). Our fused loopy[i] = x[i] * scale * w[i]is scalar and the compiler may not vectorize the two multiplications as efficiently.”
So it rewrote the kernel with explicit AVX2 and NEON intrinsics. On its own the measured impact was within noise, but it stacks with the flash attention fusion and reduces TG variance, likely from more predictable memory access patterns.
5. Flash attention KQ fusion
The tiled flash attention path does scale -> pad -> add mask -> find max as separate passes over the QK tile. The agent fused these into a single AVX2 FMA pass:
// Before: 3 passes over KQ tile
ggml_vec_scale_f32(M, kq, scale);         // pass 1
ggml_vec_add_f32(M, kq, kq, mask_row);    // pass 2
ggml_vec_max_f32(M, &max, kq);            // pass 3

// After: 1 AVX2 FMA pass
__m256 vscale = _mm256_set1_ps(scale);
__m256 vmax = _mm256_set1_ps(-INFINITY);
for (int i = 0; i < M; i += 8) {
    __m256 v = _mm256_fmadd_ps(_mm256_loadu_ps(&kq[i]), vscale,
                                _mm256_loadu_ps(&mask_row[i]));
    _mm256_storeu_ps(&kq[i], v);
    vmax = _mm256_max_ps(vmax, v);
}
To be clear: the agent’s kernel fusions target the flash attention tiled path specifically. Flash attention (-fa 1) is a pre-existing llama.cpp feature, not something the agent invented. But the agent’s fusions live inside that code path, so the benchmark needs -fa 1 enabled to exercise them. The agent realized this partway through and switched the benchmark accordingly.
Results
The final comparison is apples-to-apples: baseline with FA enabled vs. optimized with FA enabled. Both use the same flag; the difference is the fused kernels. Verified via clean A/B builds with 5 repetitions:
x86, Intel Xeon (c6i.2xlarge, AVX-512)
| Configuration | pp512 (t/s) | tg128 (t/s) |
|---|---|---|
| Baseline + FA | 241.24 ± 2.24 | 41.37 ± 19.24 |
| Optimized + FA | 244.22 ± 1.78 | 47.62 ± 0.59 |
| Change | +1.2% | +15.1% |
ARM, Graviton3 (c7g.2xlarge, NEON)
| Configuration | pp512 (t/s) | tg128 (t/s) |
|---|---|---|
| Baseline + FA | 292.99 ± 2.47 | 94.07 ± 19.87 |
| Optimized + FA | 298.56 ± 4.28 | 98.77 ± 2.59 |
| Change | +1.9% | +5% |
The TG improvement is larger than PP because the fused attention paths matter more during text generation, where attention is a bigger fraction of total runtime. The variance is also worth noting: baseline+FA TG has ±19 t/s of noise, while optimized+FA has ±0.59 t/s on x86. The fusions eliminate intermediate writes that pollute the cache, making the hot paths more predictable.
A caveat: we ran on shared-tenancy EC2 instances with 5 repetitions. Noisy neighbors can swing results on shared hardware (see Cloud VMs are noisy below). We’re confident the direction is real across both architectures and multiple VMs, but treat the exact percentages accordingly.
We haven’t submitted a PR yet. The full diff is here.
What didn’t work
Experiments that failed
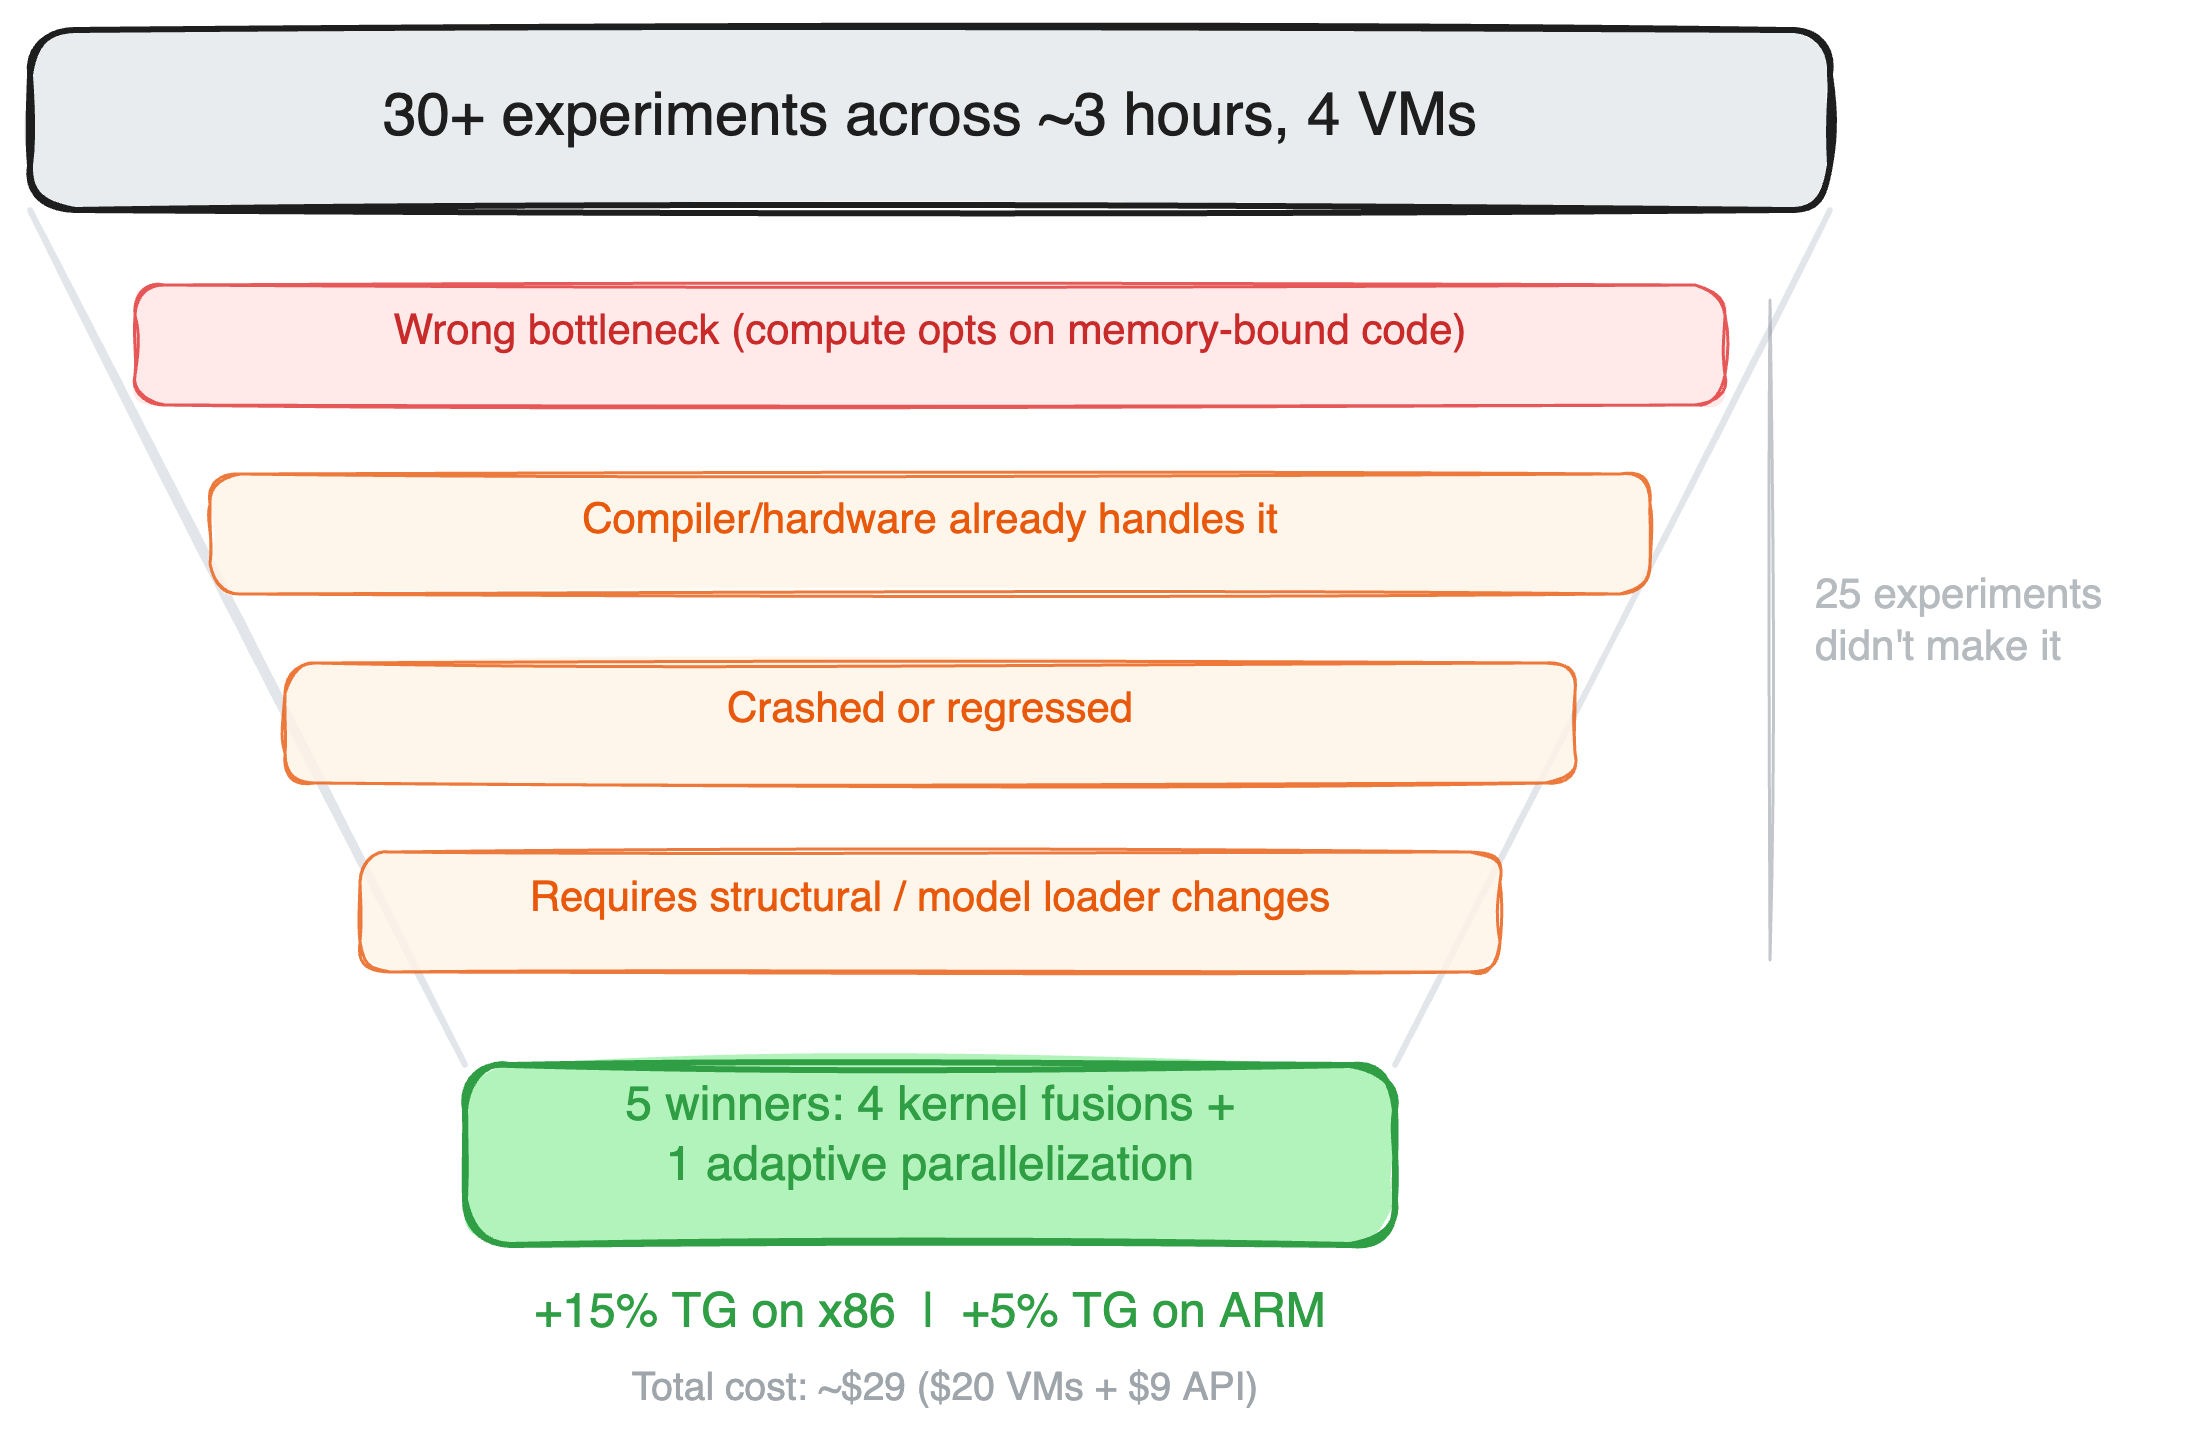
25 out of 30+ experiments didn’t make it. Some representative failures:
- SIMD softmax with deferred horizontal sum: accumulated partial sums in
__m256vectors and did a single horizontal reduction at the end. 0% improvement. The compiler auto-vectorized the scalar loop just as well. - Flash attention tile size tuning: tested Q=32/KV=128, Q=128/KV=32, Q=32/KV=32. The default 64×64 was already optimal.
- Merged gate+up matmul via
ggml_concat: tried to concatenate the gate and up weight matrices at graph construction time to save one input activation load. Crashed becauseggml_concatdoesn’t support repacked quantized tensors (Q4_0_8x8). Proper implementation requires model loader changes, not graph-time manipulation. - V prefetch during softmax computation: tried prefetching V data while computing softmax on QK. 0% improvement. The hardware prefetcher was already handling sequential access.
- Redundant load elimination in llamafile’s sgemm: the Q4_0
loadfunction doesdenibble + subtract 8, and the inner loop calls it 3 times for the same block. The agent cached the loaded values. 0% improvement, because the compiler’s common subexpression elimination already handled it.
A recurring theme: the compiler and hardware are already doing many of the things you’d think to try manually. Without experience with compiler behavior, the agent couldn’t have predicted which “optimizations” the compiler would already handle.
The benchmark bug
Our autoresearch.sh had a JSON parsing bug that reported 14 t/s instead of 52 t/s for text generation. Multiple experiments ran against wrong baselines before we caught it. The bug: llama-bench outputs JSON with n_prompt and n_gen fields, and the parsing script filtered on a field name that didn’t exist.
A human would also make this mistake, but would probably spot the unreasonably low numbers sooner. The agent trusted its own script.
Cloud VMs are noisy
EC2 instances on shared hardware showed up to 30% variance between runs due to noisy neighbors. We learned this the hard way: exp-08 showed “+2.1% improvement” that turned out to be within noise when the baseline was re-measured. VM-02 consistently showed higher variance than the others.
Mitigations: replace noisy VMs with fresh ones (new VMs often land on quieter hosts), use stddev as a quality signal, and only trust results where stddev < 2% of the mean.
The code review
After producing the optimizations, the agent reviewed its own changes against llama.cpp’s codebase conventions and past maintainer feedback. It caught a correctness bug in its own graph fusion code: the hand-rolled pattern detection didn’t check whether the intermediate RMS norm output had other consumers in the graph. If another node reads from that output, the fused kernel (which writes only to the MUL output) would leave it uninitialized.
The fix: use the existing ggml_can_fuse() infrastructure, which validates use counts, compute flags, output flags, and view source chains. Every other backend (CUDA, Metal, Vulkan, OpenCL) already uses this.
What this means for coding agents
The standard autoresearch loop (brainstorm from code, run experiments, check metrics) works when the optimization surface is visible in the source. The Liquid results prove that. But for problems where the codebase doesn’t contain enough information to generate good hypotheses, giving the agent access to papers and competing implementations changes what it tries.
The Wave 1 experiments on llama.cpp were all variations on “make this loop faster,” the kind of hypothesis you get when your only context is the code. After reading papers on operator fusion and studying how CUDA/Metal backends handle the same operations, the agent started asking different questions: “can I fuse these two operations to eliminate a memory pass?” and “does this pattern exist in other backends but not CPU?” Those questions led to optimizations #4 and #5.
Here’s how this run compared to our previous GPU autoresearch work. Note that these target very different problems (ML training hyperparameters vs. compiled C++ kernels), so the numbers aren’t directly comparable:
| GPU Autoresearch | Literature-Guided Autoresearch | |
|---|---|---|
| Target | ML training (karpathy/autoresearch) | Any OSS project |
| Compute | GPU clusters (H100/H200) | CPU VMs (cheap) |
| Search strategy | Agent brainstorms from code context | Agent reads papers + profiles bottlenecks |
| Experiment count | ~910 in 8 hours | 30+ in ~3 hours |
| Experiment cost | ~5 min each (training run) | ~5 min each (build + benchmark) |
| Total cost | ~$300 (GPU) | ~$20 (CPU VMs) + ~$9 (API) |
The experiment count is lower because each llama.cpp experiment involves a full CMake build (~2 min) plus benchmark (~3 min), and the agent spent time between waves reading papers and profiling. With GPU autoresearch, the agent could fire off 10-13 experiments per wave and get results in 5 minutes. Here, it ran 4 experiments per wave (one per VM) and spent time between waves doing research.
Try it on your own project
The setup works with any project that has a benchmark and a test suite. Clone your target, download two files, and point your coding agent at the instructions:
# Clone your target project
git clone https://github.com/<org>/<project>.git
cd <project>

# Download the experiment template and agent instructions
curl -fsSL https://raw.githubusercontent.com/skypilot-org/skypilot/master/examples/autonomous-code-optimization/experiment.yaml -o experiment.yaml
curl -fsSL https://raw.githubusercontent.com/skypilot-org/skypilot/master/examples/autonomous-code-optimization/instructions.md -o instructions.md

# Point your coding agent at the instructions
claude "Read instructions.md and optimize <project> for <your metric>."
Or use the one-line setup:
export TARGET_REPO="https://github.com/<org>/<project>.git"
curl -fsSL https://raw.githubusercontent.com/skypilot-org/skypilot/master/examples/autonomous-code-optimization/setup.sh | bash
ML inference frameworks are good candidates because they move fast, have clear throughput metrics, and new optimization opportunities keep appearing with each major feature. Some starting points:
| Project | Metric | Literature angle |
|---|---|---|
| vLLM | tokens/s via benchmark_throughput.py | PagedAttention scheduling, prefix caching, speculative decoding |
| SGLang | tokens/s, TTFT | RadixAttention, constrained decoding, chunked prefill |
| llama.cpp | tokens/s via llama-bench | Operator fusion, quantized matmul, cache-efficient attention |
| TensorRT-LLM | tokens/s via benchmarks/ | Kernel fusion, KV cache optimization, in-flight batching |
| ggml | test-backend-ops perf | SIMD kernels, quantization formats, graph optimization |
| whisper.cpp | real-time factor via bench | Speculative decoding, batched beam search |
We also tried more established projects (Valkey/Redis, PostgreSQL, CPython, SQLite) and found it harder to surface improvements. Those codebases have been optimized by hundreds of contributors over decades, and the gains the agent found were within noise.
Set infra: in the YAML to target a specific backend (infra: k8s for Kubernetes, infra: aws for AWS, etc.).
The full setup is at skypilot/examples/autonomous-code-optimization.
To receive latest updates, please star and watch the project’s GitHub repo, follow @skypilot_org, or join the SkyPilot community Slack.