As a member of the Zig core team, one of the most impactful projects I’ve been involved with is the implementation of incremental compilation into the Zig compiler. This feature allows the compiler to detect which individual functions and declarations have changed since a project was last built, recompile only that code, and directly patch the resulting bytes into the output binary, making the rebuild extremely fast.
The Zig project has been working towards this feature for a long time, and over the last few release cycles, it has finally gone from a proof-of-concept quality feature to one which is viable for real-world projects and which most of the Zig core team makes daily use of.
Today, using Zig’s incremental compilation, you can make changes to real, complex applications in a matter of milliseconds.
But don’t just take my word for it! Here’s a simple video (no audio) demonstrating me using Zig to quickly make and test some changes to Fizzy, a pixel editor application. The initial build takes around 5 seconds, and then every time I make a change, a rebuild completes in 50–70ms.
For this demo, I had to upgrade Fizzy to Zig’s master branch. This is because while Zig 0.16.0 does have support for incremental compilation, it is missing some important linker features which have since been implemented. This means that if you prefer to stick to tagged releases of Zig, you likely won’t be able to try this out until 0.17.0 drops; sorry!
If you’re already convinced and just want to know how to use this, great! Head on down to the last section of this post to find out. But perhaps you’re understandably skeptical that this is applicable to most projects, or, like me, you just enjoy learning how stuff like this works. For all of you folks, let’s dig into the details!
Processing Source Files
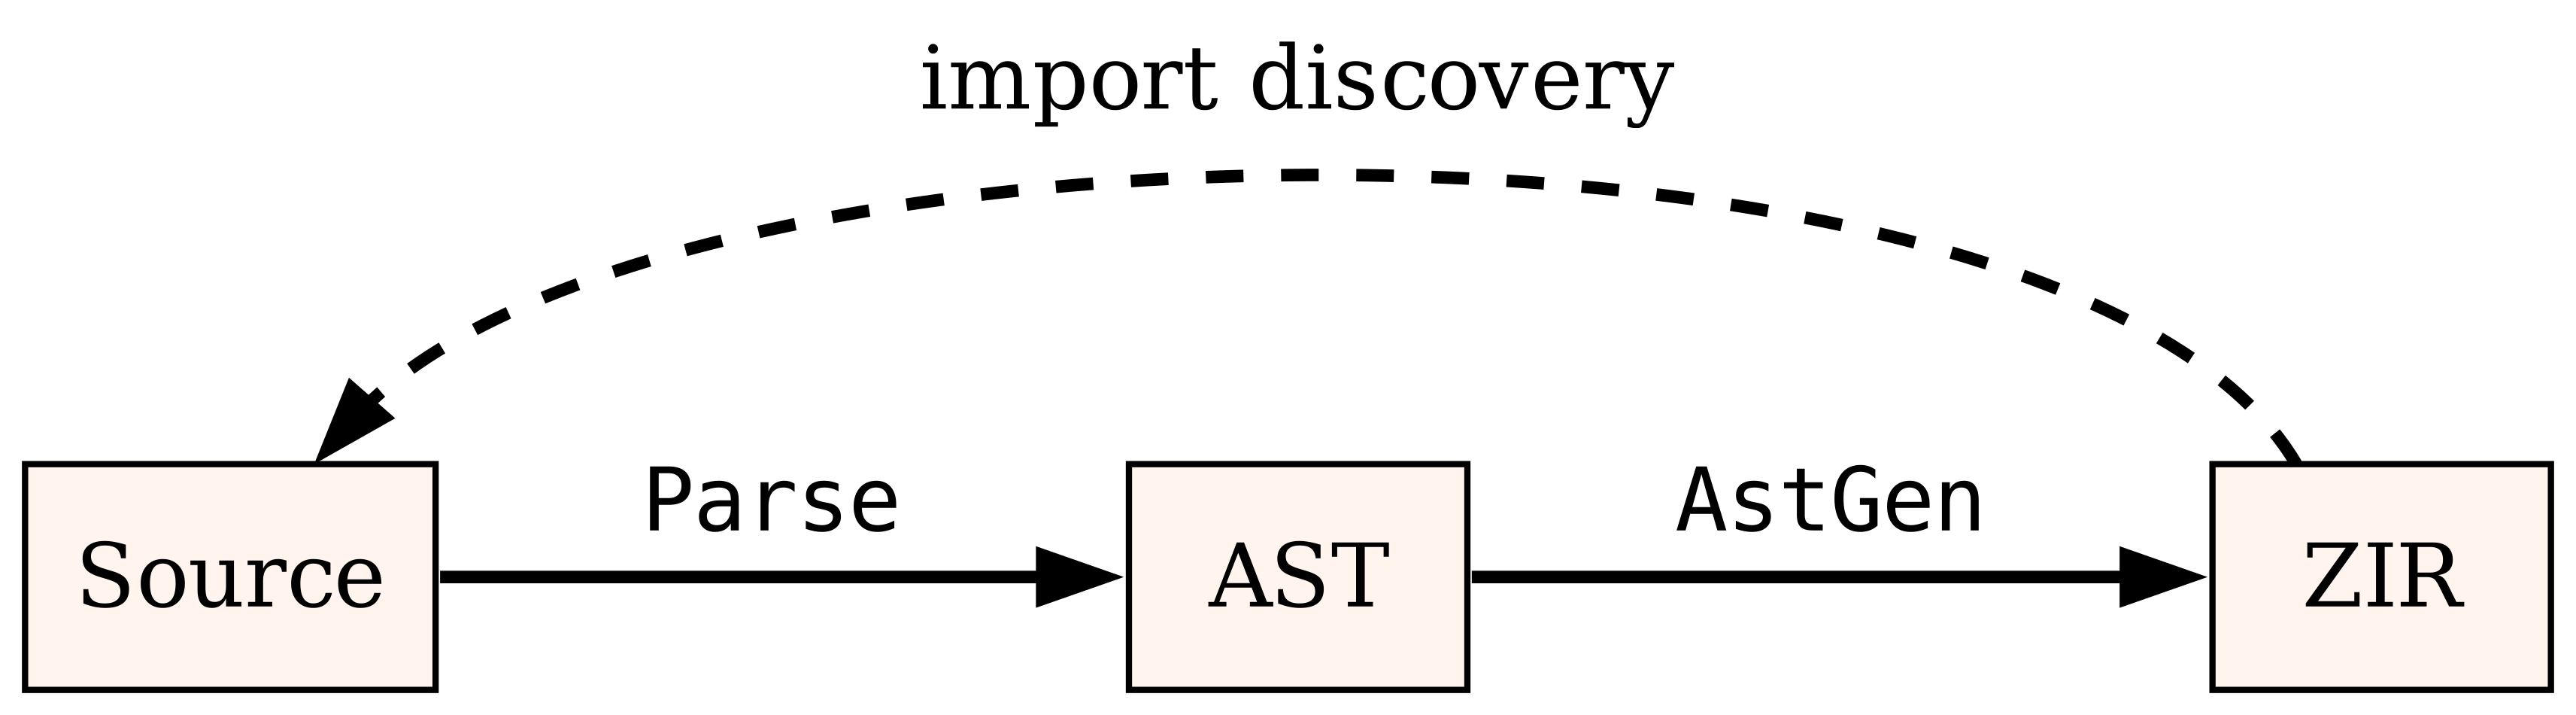
The Zig compiler’s pipeline can be split up into a few different parts, which we’ll look at in order. The first part works at the granularity of entire source files, and basically consists of running the following process in a loop:
- Read in a source file from disk
- Parse that file into an AST
- Convert that AST into a format named “ZIR” using a pass named “AstGen”
If you’re curious, ZIR (Zig Intermediate Representation) is an untyped SSA-form IR—but don’t worry if you have no idea what that means, because it won’t really matter here. All we care about is that we’re converting an entire source file into a different format.
While AstGen runs, it learns about all Zig imports (@import("foo.zig")) in the source file, so we can repeat this entire process on all of the imported files. So by running this process in a loop, we will ultimately discover every Zig source file in the compilation, and will convert them all to ZIR.
This part of the pipeline actually has several useful properties:
- The processing run on each file is a pure function of that file’s contents, involving no shared or external state
ParseandAstGenare both quite fast on their own: on my laptop, running them both over the entiresrc/directory of the Zig compiler (with no parallelism at all) takes around 920ms- Thanks to Zig’s usage of data-oriented design patterns, ZIR can be trivially written to and read from disk with one writev/readv system call—there is no “serialization” step.
These properties have two nice consequences.
Firstly, assuming one “task” per source file, this entire process is embarrassingly parallel. That means we can trivially run it on a thread pool by queuing up a task every time we discover a new source file from an import—the only shared state (which we’ll just protect with a mutex) is a hash set keeping track of which file paths we have already seen.
Secondly, and arguably even more importantly, these properties make it very straightforward to implement incremental compilation for this part of the pipeline. All we need to do is cache each source file’s generated ZIR on disk, and only rebuild it when we detect that the file changed.
Both of these optimizations have been enabled by default in Zig for years—they are battle-tested and make this part of the pipeline near-instantaneous in most cases. If you’re using Zig, you can see how fast this is using the progress output on stderr—when it says “AST Lowering”, this part of the pipeline is running. I’d guess that a lot of Zig users only even notice that happening the very first time they run the compiler (because on its first run the compiler needs to do this work for the entire Zig standard library and compiler_rt).
Okay, so, we made this part fast! That’s great, but the bad news is that this was the easy part—lots of compilers can already do this kind of caching. From here, things will get trickier.
Semantic Analysis
The next part of the pipeline is arguably the most important: semantic analysis. This includes both type checking and comptime evaluation.
The job of semantic analysis is essentially to “interpret” the ZIR we produced earlier, emitting compile errors (such as type errors) along the way; and, for runtime functions, building another intermediate representation which can be sent on to later parts of the pipeline.
Before we move forward, a quick terminology clarification. A “container-level declaration” is the Zig equivalent of what other languages call a “top-level declaration”. That term is inaccurate in Zig, because container-level declarations do not have to be at the top level syntactically, but the concept is the same. If I say “container-level declaration”, I basically mean “a function, global constant, or global variable”.
Semantic analysis is the most difficult part of the compiler to handle incrementally. Perhaps unsurprisingly then, this is where language design starts to matter a lot: while I am pretty confident that most modern languages could support incremental compilation similar to how we do, certain design decisions can make that much more difficult. Zig has had its design tweaked over the years (sometimes controversially) specifically so that it is easier to support fast incremental compilation.
The name of the game here is to split up your compilation into a bunch of pieces which you can mostly analyze independently of one another, and, crucially, where the dependencies that do exist between those pieces can be easily modeled in a dependency graph.
In the Zig compiler, we call these pieces “analysis units”, or I might sometimes just say “unit” for short. I’m going to ever so slightly simplify things here and tell you that the Zig compiler has four different kinds of analysis unit:
- The layout (size, alignment, etc) of a
structoruniontype. - The type of a container-level declaration.
- The value of a container-level
constdeclaration. - The body of a runtime function.
During semantic analysis of a particular unit, we populate a set of other units which this unit depends on. Let’s look at a basic example:
var global_0: u32 = 123;
const global_1: u32 = 456;

pub fn foo(cond: bool) u32 {
    if (cond) {
        return global_0;
    } else {
        return global_1;
    }
}
Here’s what happens when we analyze the body of the function foo:
- Because the argument
condis not comptime-known, we semantically analyze both branches of theif - Take a pointer to
global_0, in preparation to load from it- Add dependency: type of
global_0
- Add dependency: type of
- Load
global_0at runtime, because it isvarso does not have a comptime-known value - Take a pointer to
global_1, in preparation to load from it- Add dependency: type of
global_1
- Add dependency: type of
- Load
global_1at compile time, because it has a comptime-known value- Add dependency: value of
global_1
- Add dependency: value of
So we end up with this function body depending on the types of global_0 and global_1, and the value of global_1 (since that’s comptime-known). This tells the compiler that if the type of global_0 or global_1 changes, or the comptime-known value of global_1 changes, the function should be re-analyzed.
Dependencies on the body of a runtime function are impossible (at least in the simplified view I’m presenting here). This means that function body analysis units can only have “outgoing” edges in the dependency graph (i.e. they may depend on other units, but other units do not depend on them).
Dependencies on the value of a const declaration only arise due to Zig’s ability to use those at comptime. If not for that language feature, dependencies on the value of a declaration would be impossible, just as it is impossible to depend on the body of a runtime function.
Dependencies on a type’s layout arise, in short, from having values of that type, or from needing to know something about the type’s layout. I’m not going to discuss this any further here, because it’s a bit complicated and quite specific to Zig’s type system, but it’s not fundamentally different.
Okay, so, we’ve told the compiler about when re-analysis of one thing needs to also trigger re-analysis of another thing. However, there’s one more puzzle piece here—source code dependencies. By itself, this dependency graph is useless: what do we actually do when the user asks for a recompile (what we call an “incremental update”)? We don’t know the first thing to re-analyze!
To solve this problem, we track dependencies of analysis units, not only on other units, but also on pieces of source code. In the cases we’ve looked at so far, these are all really simple: in the snippet above, the units “type of global_0” and “value of global_0” both depend on the source code of global_0, the unit “type of global_1” depends on the source code of global_1, and the unit “body of foo” depends on the source code of foo. Whenever any byte of source code in the given region is modified, the dependent analysis unit will be marked as “outdated” and re-analyzed.
Note that in reality, things can get more complicated than each unit depending on one piece of source code. For example, an inline function call in Zig performs semantic inlining, which means that it essentially triggers semantic analysis of a different piece of code but in the caller’s analysis unit. Therefore, inline function calls introduce dependencies from the caller’s analysis unit on the source code of the callee.
Of course, we still need to be able to figure out which regions of source code have changed since an incremental update. For this, ZIR contains hashes for specific “interesting” regions of source code (e.g. the entire source code for each container-level declaration), and those hashes are what you are actually depending on. If the source code changes, the hash changes, and that’s easy for the compiler frontend to detect.
Okay, that was a lot of explaining—now let’s look at some pretty pictures! Here’s some Zig source code:
const lucky_number = 42;

const S = struct { x: u32 };

fn getSomething() S {
    return .{ .x = lucky_number };
}

fn testLuck(x: u32) void {
    if (x == lucky_number) {

    }
}

export fn entry() void {
    const result = getSomething();
    testLuck(result.x);
}
…and here’s its dependency graph (with some redundant edges removed for legibility). The nodes on the right represent the source code which has been hashed, while the remaining nodes are all analysis units.
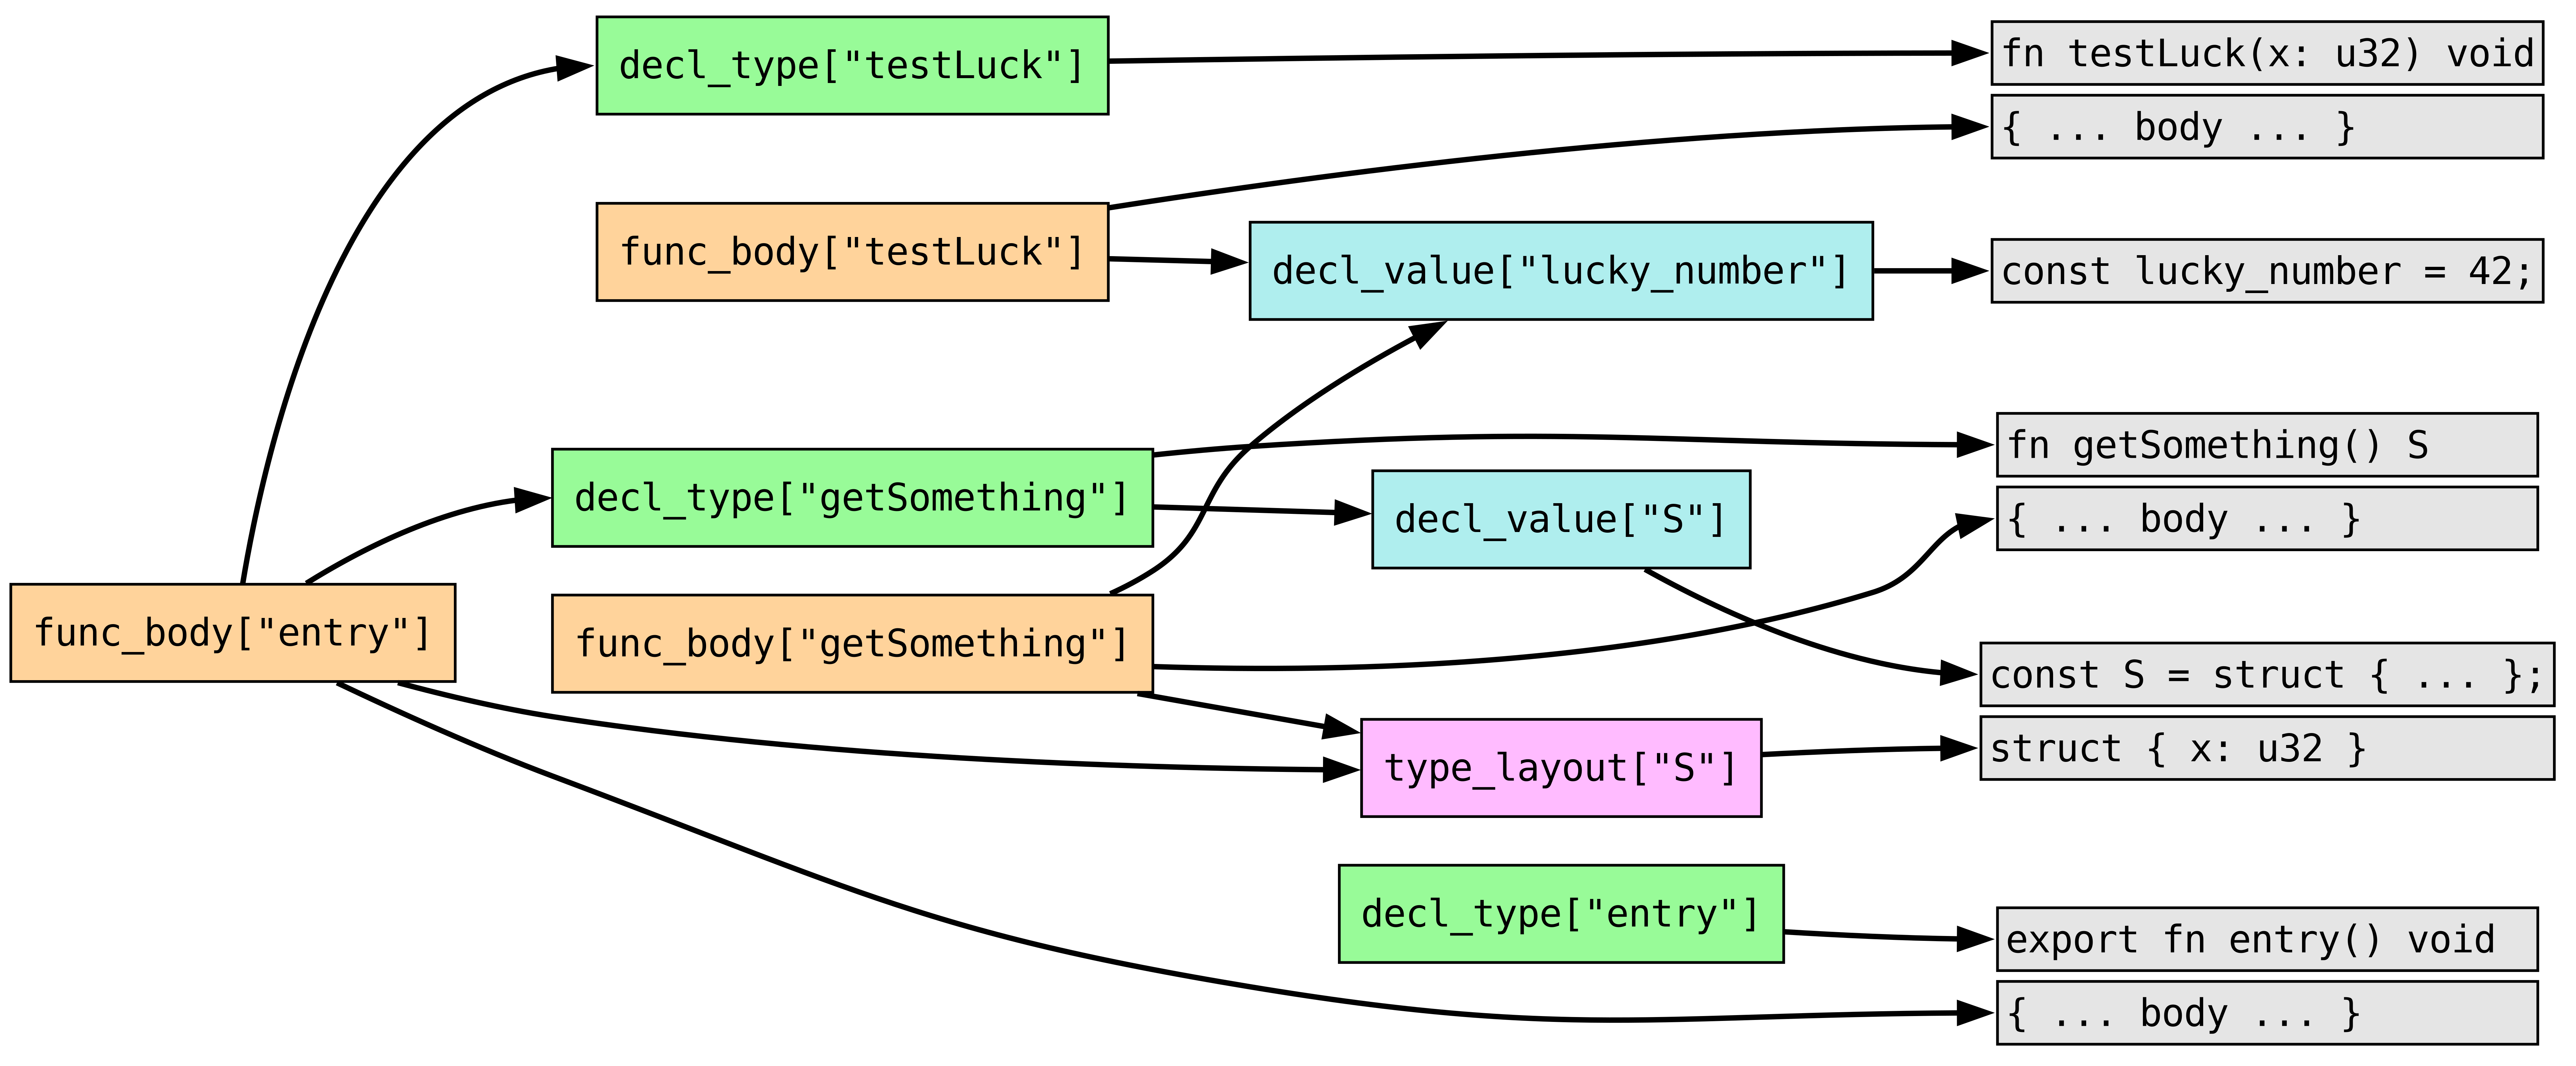
Now, let’s say we change the first line of the file to read const lucky_number = 43;. First, the compiler lowers the new ZIR for this file. It maps declarations from the old ZIR to the new ZIR based on the declaration names, and compares the source hashes associated with each declaration. In this case, it successfully maps every declaration, and it sees that one source hash changed—the one associated with const lucky_number. Next, it looks at the dependency graph to find everything which depends on that source hash. In this case, it only finds one direct dependency:
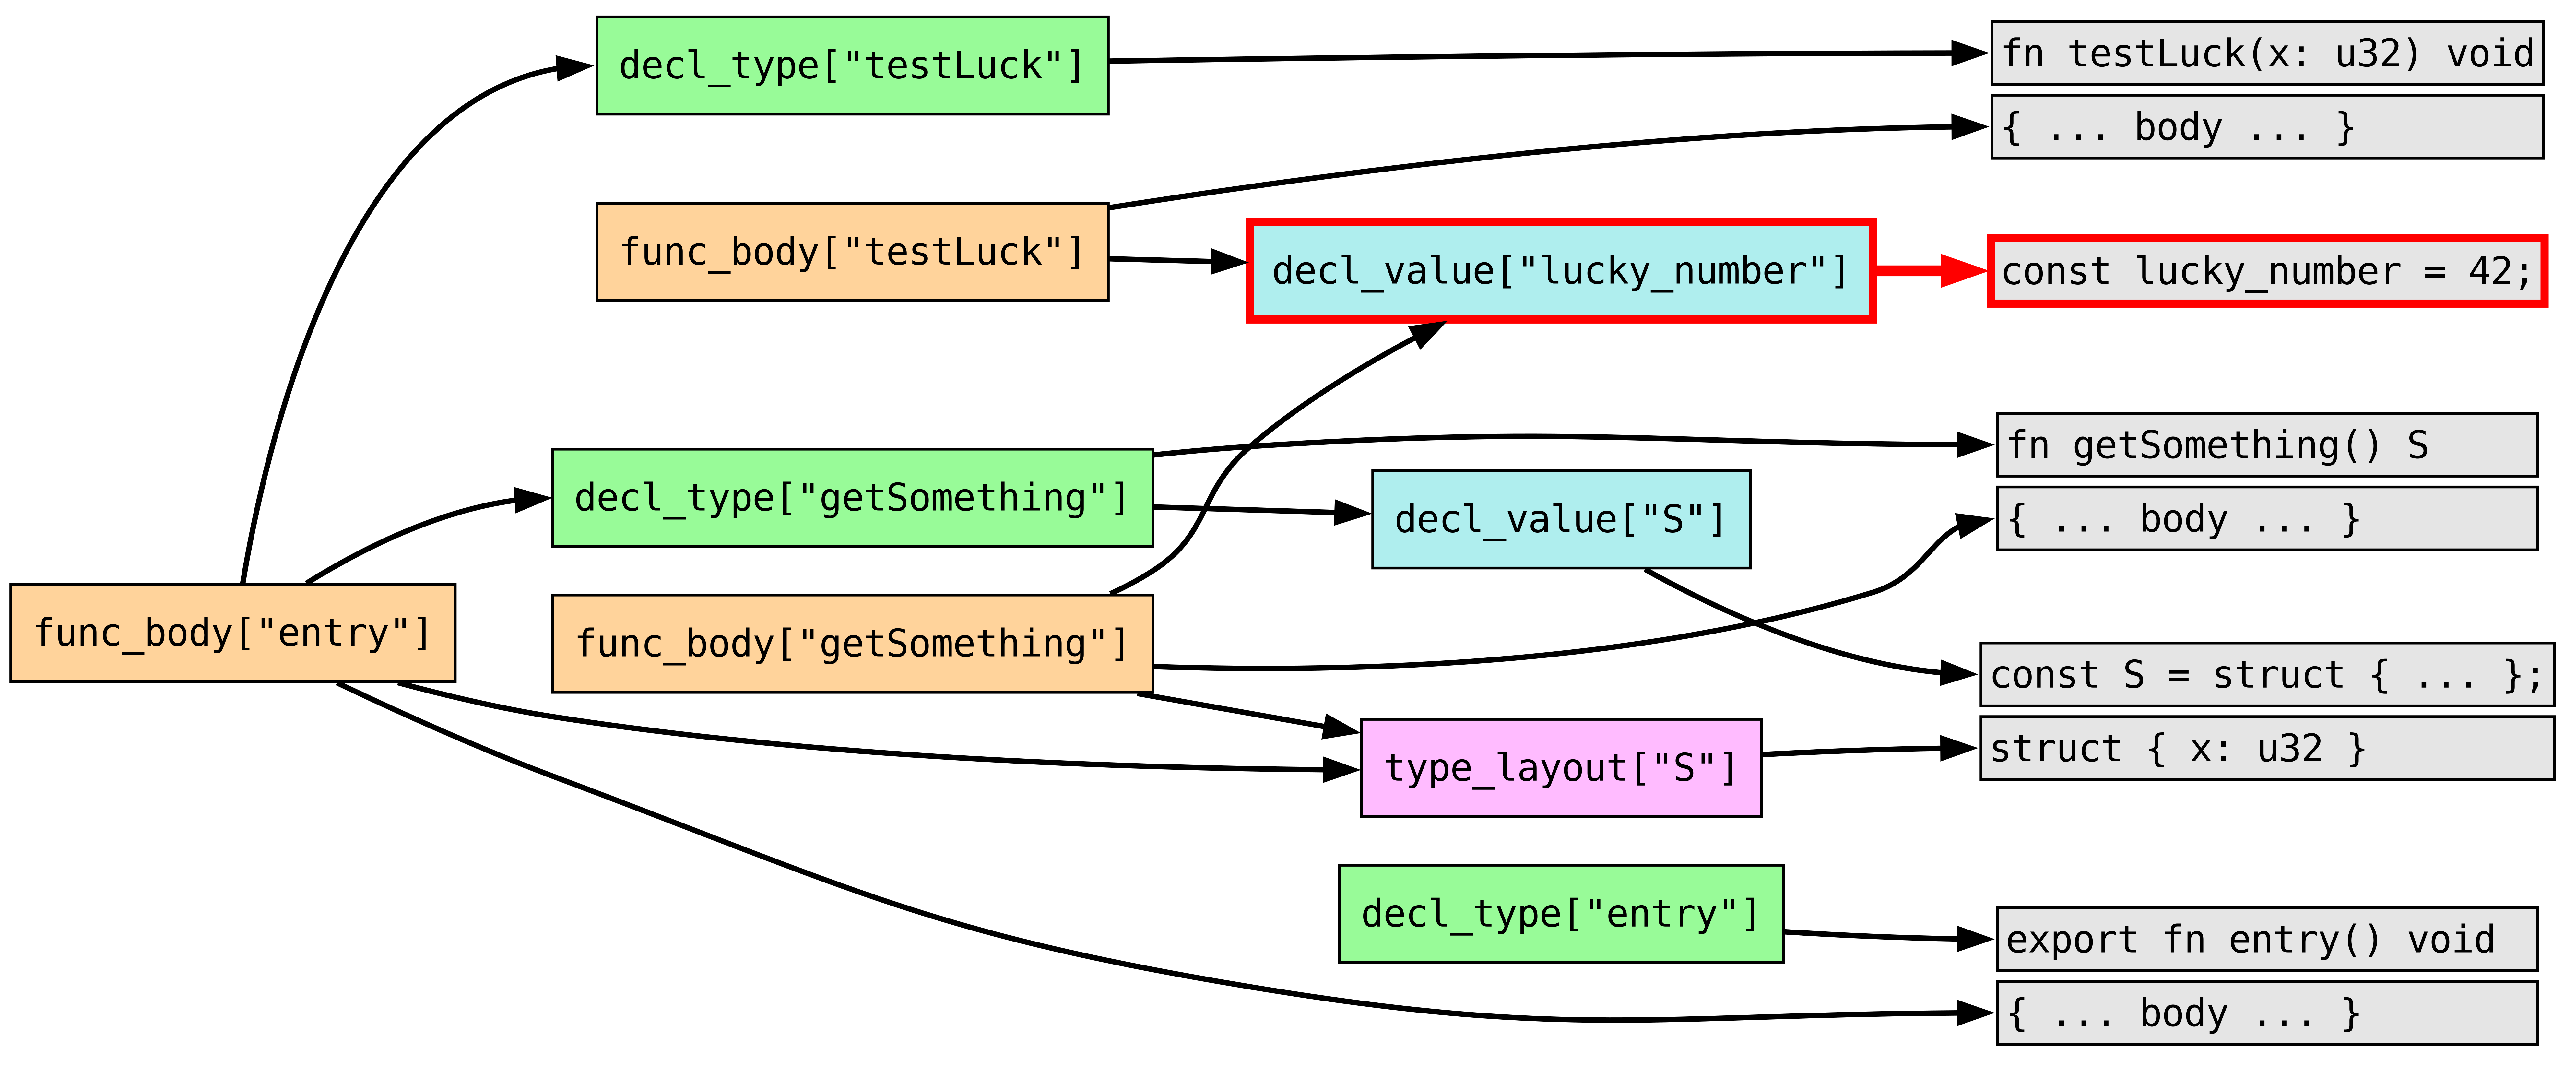
So, the compiler re-analyzes the value of the lucky_number declaration. If our change to the line had been a no-op (e.g. we just added some whitespace), then it would determine that the value did not change, and stop here. But in this case, the value did change! Therefore, the compiler continues this process, by next considering any analysis units which depend on the value of lucky_number, of which there are two:
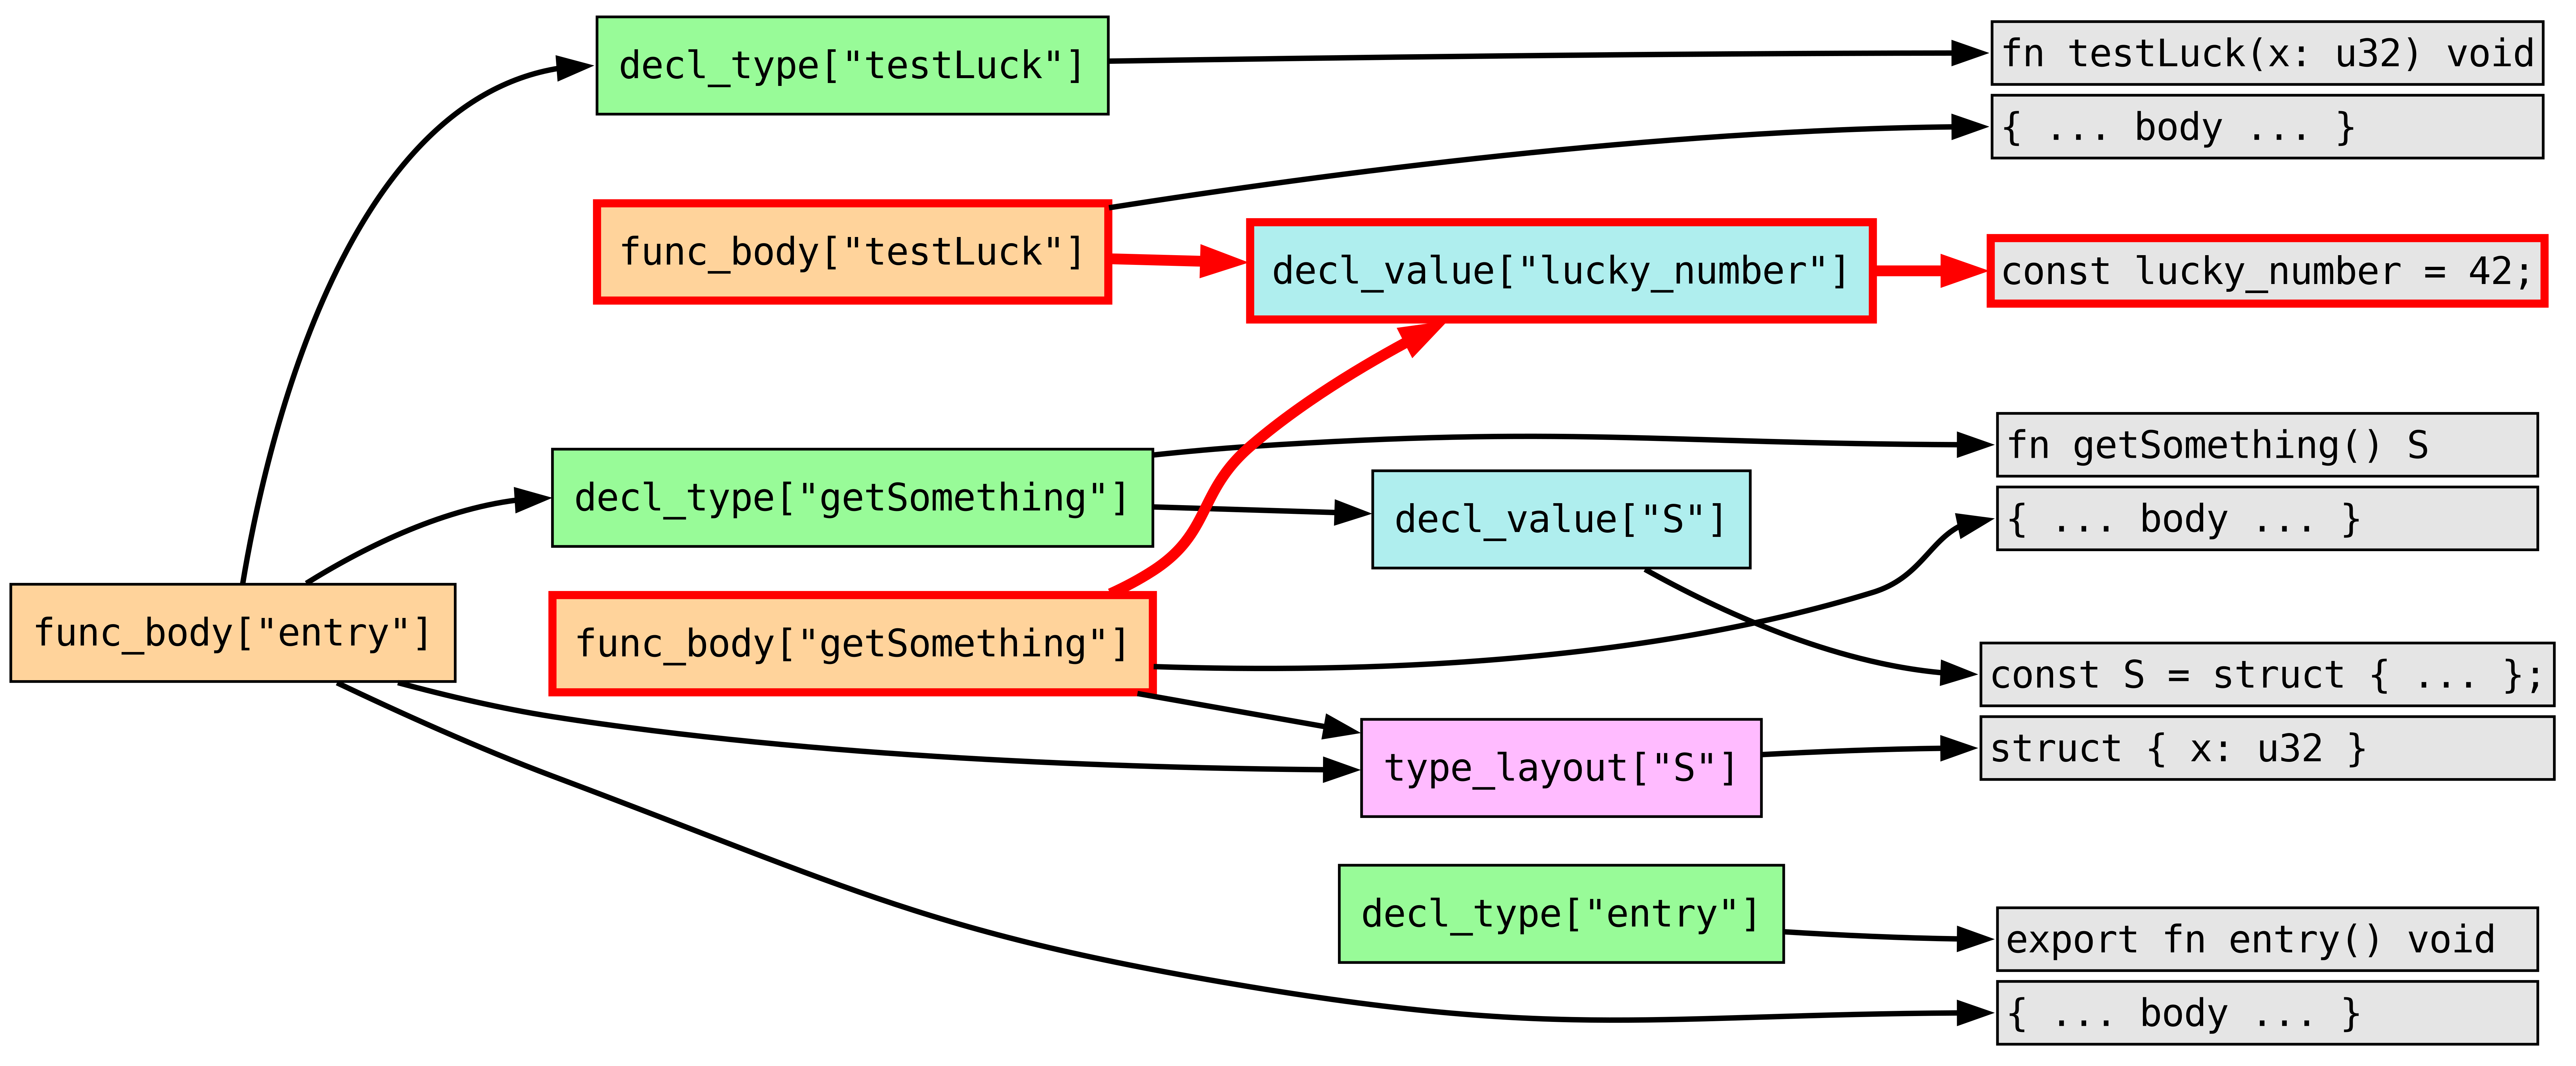
lucky_number valueThe compiler analyzes those two units—the bodies of testLuck and getSomething. There are no dependencies on these units (since they’re function bodies), so the semantic analysis loop stops here. However, semantic analysis of those functions does generate new AIR, which brings us neatly to our next topic: code generation.
Code Generation
Code generation, sometimes called “codegen” for short, is the stage in the compiler pipeline where AIR from semantic analysis is converted to something resembling machine instructions. Codegen doesn’t quite emit machine instructions yet—instead it’s something called MIR (Machine Intermediate Representation)—but there is almost a 1–1 mapping between MIR instructions and machine instructions. There are separate codegen implementations for each target architecture (x86_64, aarch64, etc).
A nice thing about codegen is that just like the whole-file processing earlier, it is an embarrassingly parallel task (at least in builds where you aren’t doing inter-function optimizations like inlining). There is no state shared between code generation of different functions, so we can have a queue of pending functions whose AIR needs converting to MIR, and process that queue across arbitrarily many threads. There’s just one small gotcha, which is that we need to be careful to cap the size of that queue, because if codegen is ever running behind semantic analysis for any reason, the size of the queued-up AIR can add up fast!
In terms of incremental compilation, this phase of the pipeline is actually as simple as it gets, because AIR and MIR both exist at the granularity of individual functions, which is the same granularity incremental compilation works at. This means that there is no need for the compiler to cache AIR or MIR at all! The AIR is thrown away as soon as code generation is done, and the MIR will be thrown away right after it’s consumed by our next stop: the linker.
Linking
Incremental linking is kind of a difficult problem, and I suspect is a big reason that no other major toolchain supports this kind of incremental compilation yet. General-purpose incremental linkers aren’t really a thing at the moment, and though wild was originally conceptualized as one, that project seems to have shifted its focus firmly towards cold-link performance over the past couple of years, with no explicit timeframe for incremental linking.
David Lattimore, the creator of wild, has a blog post discussing some of the difficulties of incremental linking. One of those is diffing input objects to figure out what actually changed on an update. However, when you control the entire compilation pipeline, a simpler design presents itself which neatly sidesteps that entire problem: tightly integrating the linker with the compiler.
To begin with, let’s just look at how the linker might work without incremental compilation. Because linking involves a lot of shared state, our linker is entirely single-threaded (maybe we’ll look into multi-threaded linking in the future, but for now we’re keeping things simple). When the linker receives MIR from codegen, it first needs to convert that MIR into the actual machine code. This logic is specific to the codegen backend, but we can’t run it until now because it requires cooperation with the linker. That’s because while emitting machine code, the codegen backend generates relocations—basically, instructions for the linker to overwrite certain parts of the code with specific addresses or values (for instance the address of another symbol). The linker needs to save all of these relocations internally, so we need to be on the linker thread for this.
After generating the machine code and associated relocations, we reserve space for that machine code in the output section (usually .text). We save the machine code in a buffer, save the relocations to apply later, and do some miscellaneous bookkeeping work, such as adding a symbol table entry.
For a non-incremental linker, this would be the end of the story. At the end of compilation, we would assign addresses to every section, write out everything we reserved space for, and apply all of the relocations. Incremental linking is a bit trickier—writing the machine code to the file, assigning addresses, and applying relocations, all ideally needs to happen before we know the full contents of the binary, and we need to be able to update those things later.
A lot of the complexity here is actually just in moving things around. For example, if we want to add a function to the .text section, but there isn’t enough space, we need to expand that section. But the section might be surrounded by other sections, which we can’t just overwrite, so we’ll need to move something—either the .text section itself, or one of the surrounding sections. In doing so, we’re going to change not only file offsets but also virtual addresses of everything we move—this means we’ll need to update symbol table addresses, re-apply relocations, etc. That’s a lot to keep track of! (There’s also a similar problem for segments, one level up.)
To solve this problem, Jacob Young introduced a nifty abstraction into the Zig compiler called link.MappedFile. It memory-maps the output file, but more importantly tracks a tree of “nodes” in that file. The root node covers the entire file, and child nodes refer to specific regions within their parent node. The API user can add nodes, or grow a node to a given size—in both cases, if there is not space in the parent to trivially perform the operation, MappedFile deals with moving other nodes around to make space. Whenever it resizes or moves a node, the implementation sets a “dirty” flag on that node, so that at some point the linker implementation can detect this and apply any necessary fixups, e.g. re-applying relocations whose target moved.
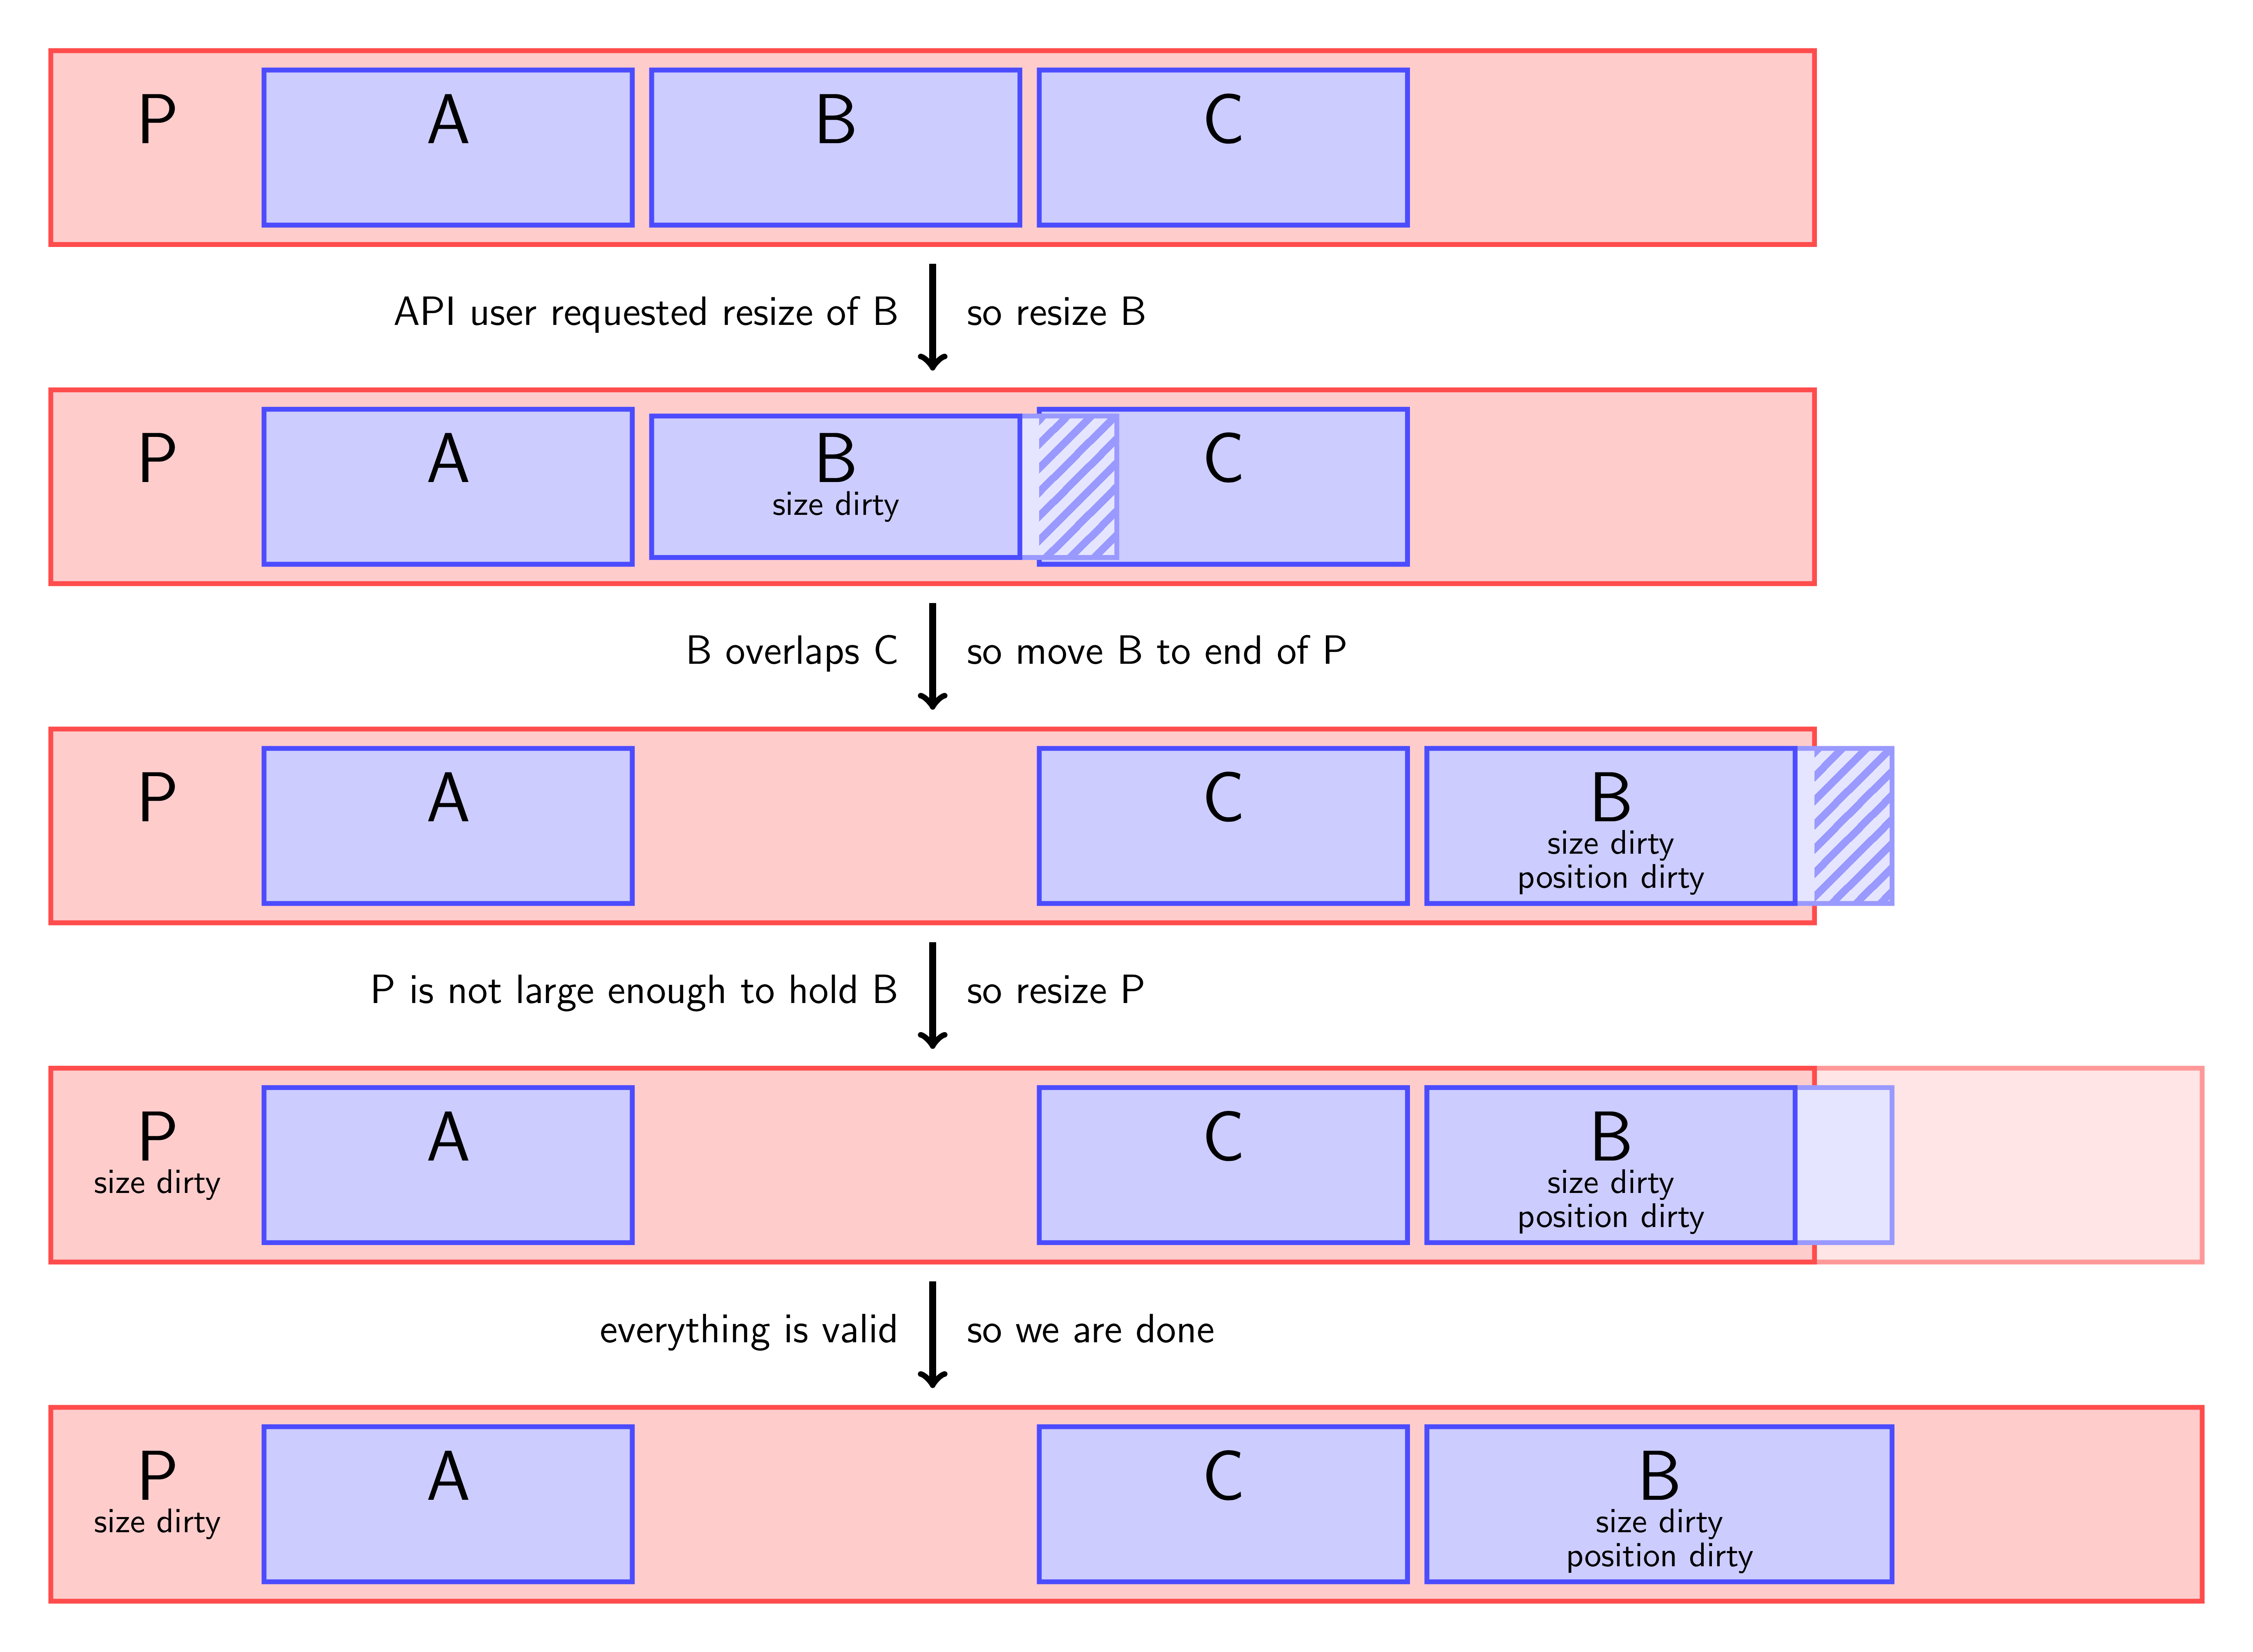
MappedFileRight now, MappedFile has fairly primitive logic for node allocation, so sometimes makes suboptimal decisions—but because we’ve abstracted it behind a neat little API, we can improve it independently going forward.
To get to incremental linking, then, we need only slightly change the process I described earlier. After we finish emitting machine code, we create a node in the mapped file, large enough to hold the code—or if this function already existed, we just resize the existing node—and we copy the machine code into it. Allocating this node in the file might (in rare cases) need to move some other stuff in the file around, in which case the appropriate “dirty” flags are set on those nodes. We always set the “dirty” flag for the function’s node itself, so that its relocations will be applied at some point.
Because of the pending relocations, we probably don’t have a valid binary right now—but that’s okay! When the linker thread is next idle (i.e. its work queue is empty), or at the end of compilation if the linker thread remains busy until then, we’ll check all of those “dirty” flags and clean up after ourselves. This could involve work such as assigning new virtual addresses, updating the section headers and program headers, updating addresses in the symbol table, and re-applying relocations.
It might sound like that “fixup” work is expensive. Sometimes, it can be—if you’re creating a dynamic executable and the PLT has to move, that can take a moment, because there are usually a lot of relocations targeting the PLT. However, most of the time, we don’t need to move anything! By using exponential growth factors on nodes (similar to how dynamic data structures like ArrayList work), we amortize this cost and make it extremely rare in reality (at the cost of a slightly increased binary size, which isn’t usually a major concern during development). This design means that you might very occasionally see one update run slightly slower than usual (maybe a few hundred milliseconds?), but I’ve not personally hit this a single time, despite using incremental compilation with this linker near-daily for the past couple of months.
Flush
Okay, we’ve made it to the end, and kept everything incremental along the way. Files were lowered to ZIR with a simple per-file cache; semantic analysis of declarations kept track of a dependency graph to figure out what might have changed; code generation re-ran only for updated functions; and our linker wrote new code into the file without changing any other bytes. We just have a few more loose ends to tie up.
Firstly, because of how Zig’s “lazy analysis” feature interacts with incremental compilation, we need to do a graph traversal to figure out which functions/declarations/etc are actually referenced. It’s possible that something was referenced on a previous incremental update (so we compiled it), but has since become unreferenced, which means we need to ignore any compile errors it emitted, not perform symbol exports from it, etc. There are probably some optimizations you can do here, but at least right now, we just traverse the full reference graph on every update. We can get away with this even on big projects, because computers are really fast!
Once we’ve figured out what’s referenced, we can tell the linker every global symbol which is exported from Zig code, so that it can add any necessary entries to the symbol table. We will also report compile errors if there are any, and some other miscellaneous tasks like that. Finally, we call the linker’s flush function, whose job is just to do any remaining linking work before the file is closed. If the linker has any MappedFile node still marked as “dirty”, we’ll need to handle that, but otherwise we want to do as little work as possible—remember, anything we do here is going to happen on every update, so we want to keep it pretty much O(1). Therefore, all that the ELF linker really does here is write out the .dynamic section, and write the entry field in the ELF header.
We then close the file, and the compilation is complete!
Tracing an Update
Explanations are cool and all, but we can actually see this happening. Tracy is a real-time profiler—it’s designed for games, but you can integrate it into anything. The Zig compiler has optional Tracy integration, enabled using a build flag. (I guess incremental updates kinda resemble frames in a video game if you squint?)
This can occasionally be useful for various compiler performance analysis, but I actually find it really cool to use for incremental compilation, because we can see the different parts of the compiler pipeline clear as day. Let’s take a look at the Tracy output for a change to Fizzy, much like the changes in the video from earlier. This particular update took 37ms (a little faster than the ones we saw in the video), but at first I’m going to zoom in on the first 6ms or so of this 37ms update—I’ll explain why later.
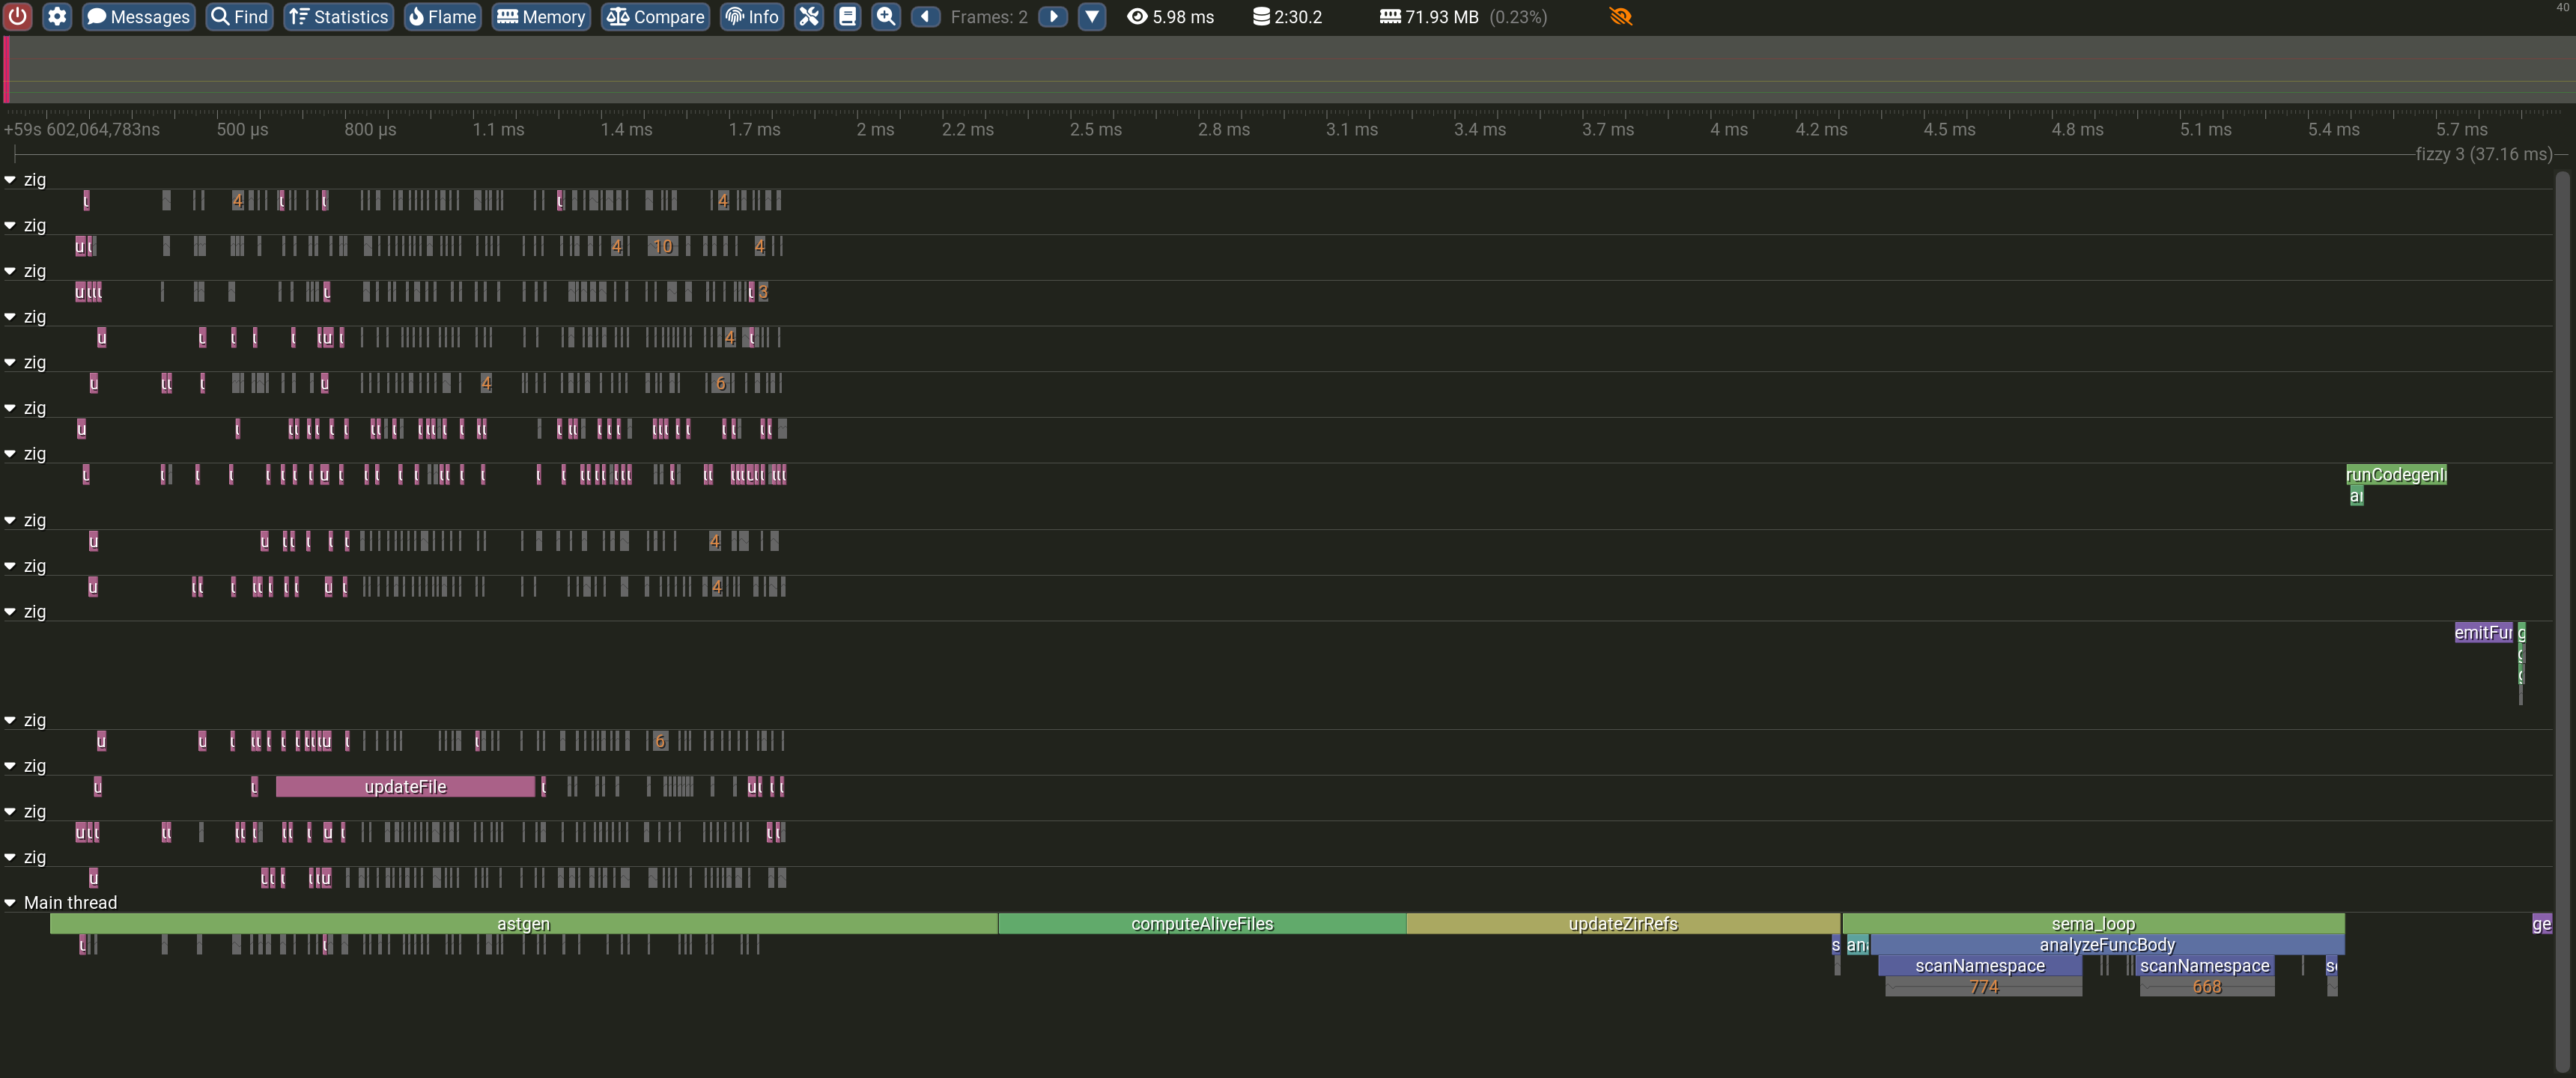
At the start we can see a flurry of activity across all threads—that’s the thread pool doing all of the per-file work. Although we only changed one file, the compiler doesn’t assume that, and instead checks every source file. There’s one small optimization here, which is that because we already know which source files were in the compilation on the last update, we can guess that those files will all still be reachable and so check for changes to all of them. That just means we don’t need to wait for the first file to be processed so that we can discover its imports.
Next we see a good chunk of time (around 1ms) in computeAliveFiles. This function is traversing the graph of file imports to assign every file to a Zig “module” (because it’s possible for a file to move from one module to another between updates). We also use this import traversal to check whether all source files are, in fact, still in the compilation. If any are not—because all imports of them were removed—then we’ll basically just ignore those files for the rest of this update.
Then we have another millisecond in updateZirRefs. This function is responsible for correlating the old and new ZIR of any changed files, and updating all internal references to ZIR instructions to refer to the instruction’s index in the new ZIR rather than its index in the old ZIR. This is a fairly simple task, but the current implementation involves iterating every ZIR instruction we hold a reference to at all and completely rebuilding a hash map’s metadata. This can probably be optimized.
Now we’re done with the single-threaded per-file stuff, and we can finally get onto the meat and potatoes of the pipeline: semantic analysis, codegen, and linking. The “sema_loop” zone contains all of the time spent in semantic analysis—around 1.2ms. We then see that function’s AIR get picked up by codegen on a different thread (the green zones named runCodegenInner), which runs for around 240us. The resulting AIR is picked up by the linker thread and emitted to the binary—this linking work (the purple emitFunction zone and the little green zones next to it) takes around 170us. Overall, this entire part of the pipeline—which by far dominates cold builds—comes in at around 1.6ms for this update. Not bad!
After that’s all done, we’re onto flush. The little purple zone at the bottom-right is a small bit of linking work the frontend requests during flush: regenerating a lookup table which we use to implement Zig’s @errorName builtin. That takes around 50us, and brings us to the end of the 6ms region I’ve zoomed in on. That means it’s finally time to zoom out and see what the remaining 31ms are…
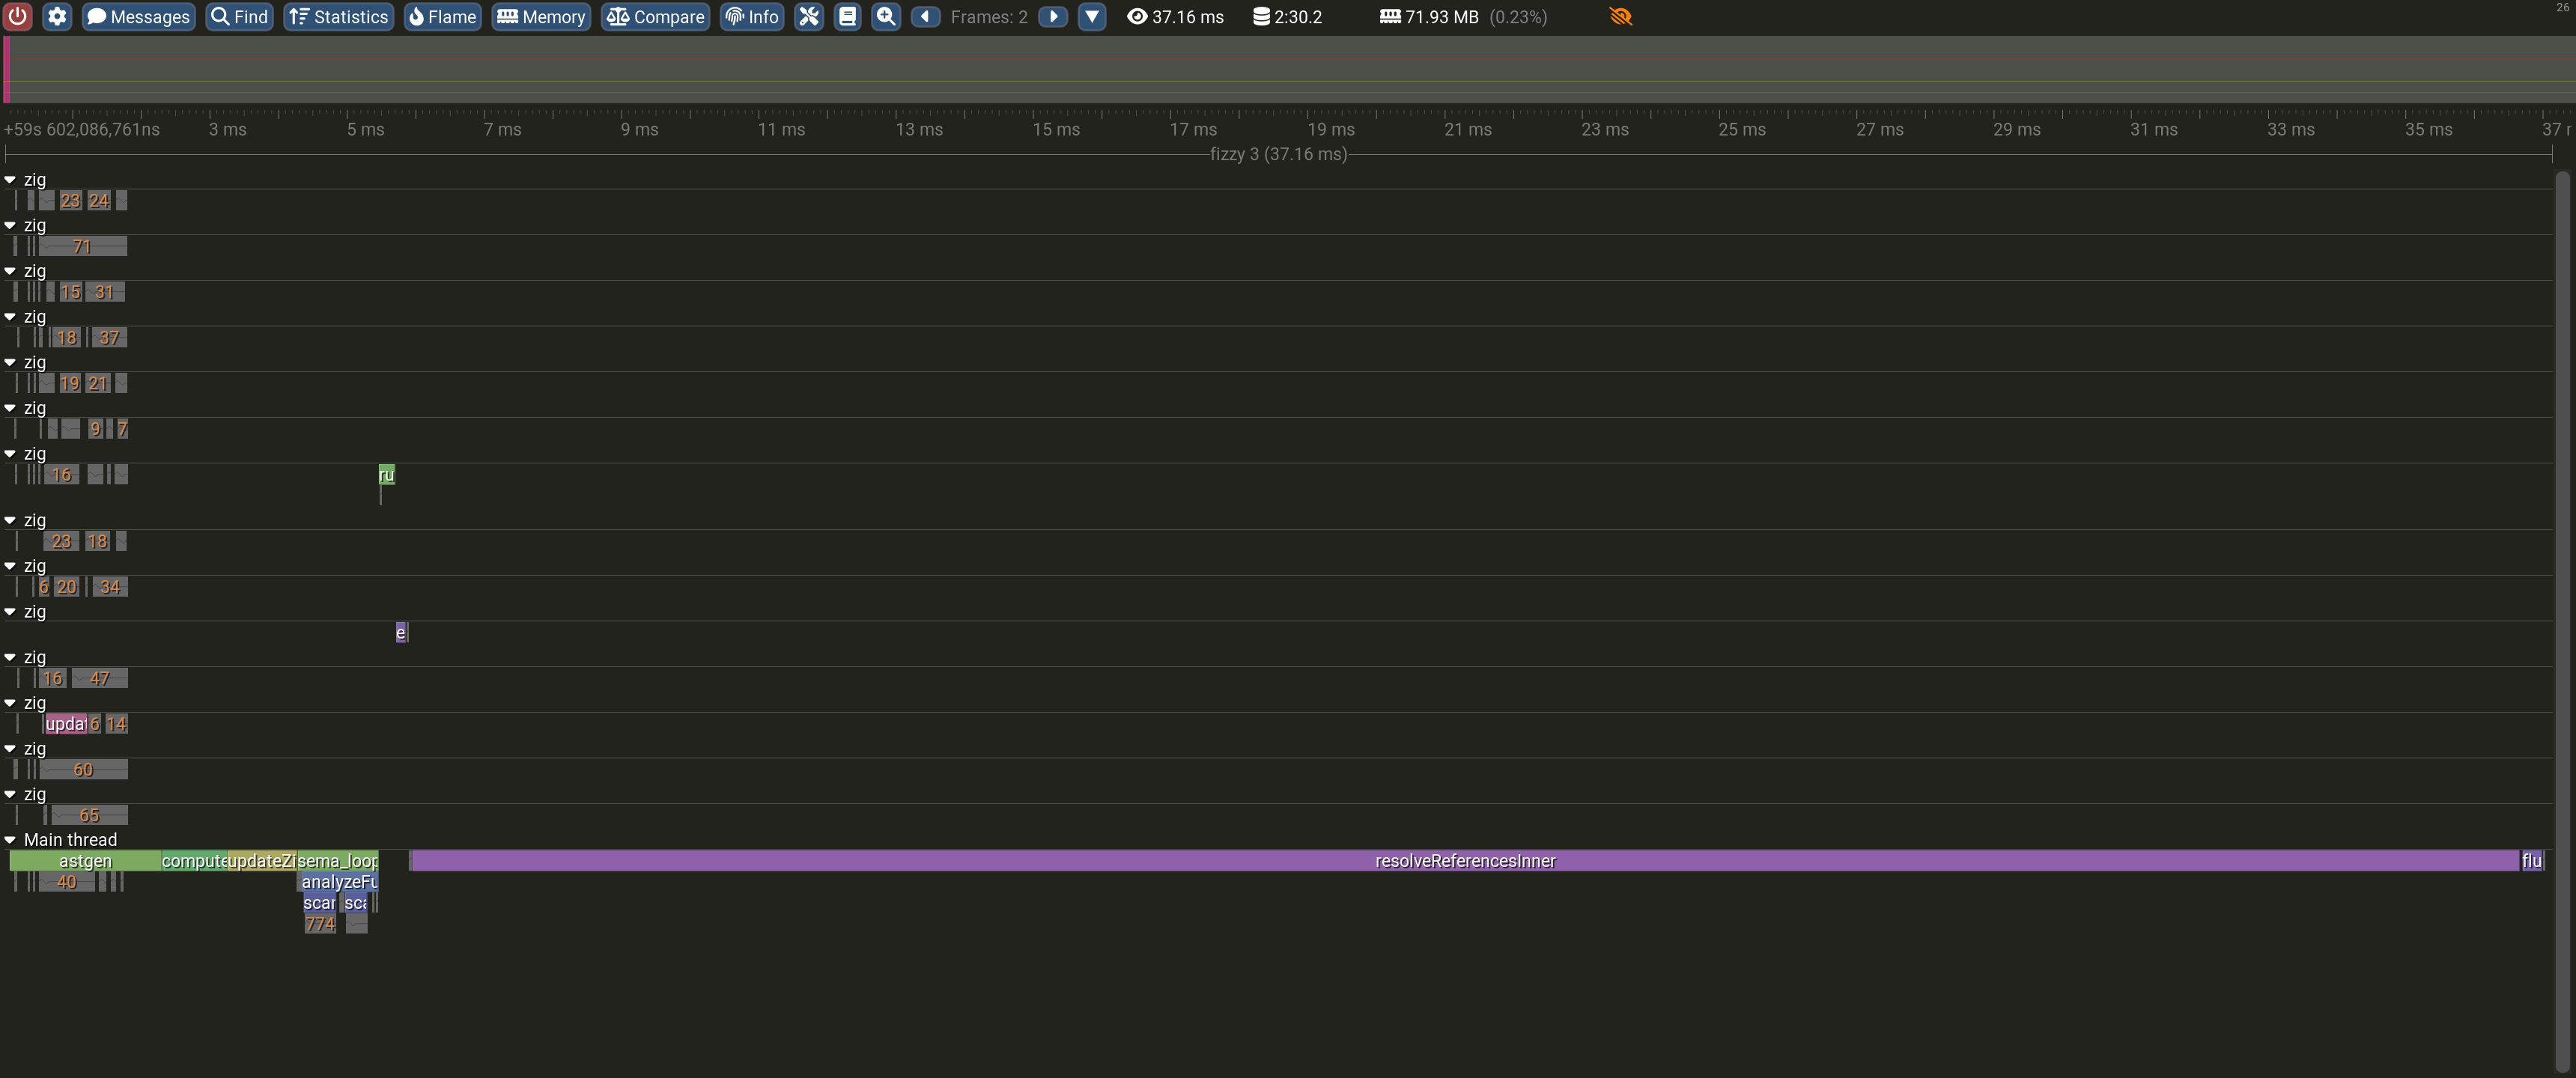
Basically all of the remaining time is spent in one function, resolveReferencesInner. Remember a bit earlier I mentioned doing a graph traversal during flush, to determine which Zig declarations are referenced? Well, that’s this function’s job! It’s not inefficient by any means, but that graph is kinda big, so it’s perhaps unsurprising that it starts to matter when we’re trying to go fast.
On the one hand, this seems pretty silly, so much so that I seriously considered trying to improve it before putting out this blog post (after all, a 7ms time is more impressive than a 37ms time). This is amplified when you consider that the reference graph didn’t actually change here. So the vast majority of the duration of this incremental update is being spent figuring out that a graph didn’t change!
But actually, I think this is really cool, because it shows how much efficiency is still left to squeeze out. This 30ms zone is realistically not a big issue, but we can get rid of it nonetheless—firstly by avoiding recomputing this data when the reference graph is unchanged, but also by only recomputing what we need to when the references do change (that problem is called “dynamic single-source shortest path” and is a fairly well-studied problem in graph theory).
Basically, we’re far from done on the performance front! If you want to keep up with what we’re doing in the future, you might consider adding the Zig devlog to your RSS reader, or checking out the release notes when new versions of Zig are released.
Using Incremental Compilation
Okay, I’ve been rambling about compilers for long enough; let me actually show you how to use this thing. I’ll assume you have a Zig project with a build script, and that it compiles on a recent master branch build of Zig (or, if you’re reading this after Zig 0.17.0 releases, that’ll also work.)
At the time of writing, this will only really work if you target x86_64-linux, because our other code generation and linker backends are not mature enough yet. The majority of the Zig core team runs Linux on x86_64, so by focusing on it first, we’ve sped up our workflows, meaning it’ll be faster for us to add support for other targets—which is now top priority!
The bad news is that right now, this isn’t zero-effort. Eventually it will be—we’ll cache all of the compiler state to disk and automatically reload the last saved state when you run zig build, so incremental compilation will just happen automatically—but we’re not quite there yet. However, the good news is that using it today requires very little work!
The short version is that you just need to run this command:
$ zig build --watch -fincremental
The --watch argument tells the Zig build system to watch the filesystem for changes to your source files, and trigger rebuilds when they happen. The -fincremental argument tells the build system that when it does one of those rebuilds, it should use incremental compilation.
When you run that command, you may notice that even if you have a warm cache, every executable/library/object in your project will be rebuilt anyway. That’s expected behavior, because the existing caches on disk are not compatible with incremental compilation. However, if this is inconvenient, then you can modify your build.zig to ask the build system to only use incremental compilation for a specific compilation:
const incremental = b.option(bool, "incremental", "Enable incremental compilation") orelse false;

if (incremental) exe.incremental = true;
Then you can use -Dincremental instead of -fincremental, and it’ll only do the full initial rebuild for that particular step. (The -fincremental option was basically telling the build system to set this flag on every std.Build.Step.Compile.)
Anyway, after the initial build is done, just edit one of your source files, save it, and you should see the results of the rebuild instantly. Assuming there are no compile errors, you’ll find the updated executable in zig-out/ as usual. That’s all there is to it!
If you combine --watch with a build step which runs your program (e.g. zig build run --watch -fincremental), your program will run every time the build finishes. For short-running programs, that’s probably exactly what you want. However, for long-running programs (e.g. graphical applications), be aware that right now, the build system will only be able to trigger incremental rebuilds after the previous build of your program closes. Depending on your personal workflow, that might be fine for you (perhaps you’ll just close the application every time you want a build), but if not, you might prefer to do a normal build and manually run the program from zig-out/. If this is you, don’t worry—we’re already planning a bunch of enhancements to the build system to unlock other workflows!
As with all of the Zig project, incremental compilation is not yet stable. While it works pretty well, there are definitely bugs right now, probably including some false-positive compile errors and even miscompilations. If you run into any problems while using incremental compilation, please do open an issue on the Zig repository if you can—the more bugs we’re told about, the more we can try to get fixed for the next release!
Thank you to all of our users who have helped to try out this feature so far, and to anyone who tries it after reading this post—it’s great to see this working for so many people. Thanks also to everyone who donates to the Zig Software Foundation: it’s a true privilege to be able to spend my time working on cool stuff like this.
And of course, thanks for reading :^)